MM207 Unit 9 Final Project Assignment and Template Kaplan University

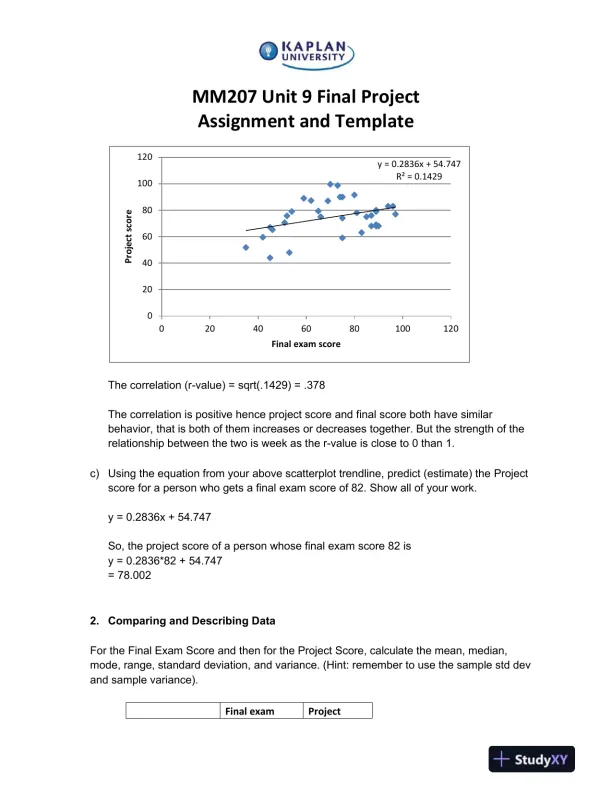
Final project assignment and template for Unit 9 of MM207.

Hannah Perez
Contributor
4.4
40
5 months ago
Preview (3 of 9 Pages)
100%
Purchase to unlock

Page 1

MM207 Unit 9 Final Project Assignment and Template Kaplan University - Page 1 preview image

Loading page image...

MM207 Unit 9 Final ProjectAssignment and TemplateMM207 Unit 9 Final ProjectAssignment and Template1.Correlation, Scatterplots, and Predictiona)Which relationship is stronger, the relationship between GPA and AGE or therelationship between GPA and SAT score? Be sure to include allappropriate measuresand explain and defend your answer. Is this result what you would expect, why or whynot?Correlation between GPA and AGE0.233751Correlation between GPA and SAT score0.320311Looking at the correlation values we see that thecorrelation between GPA and SAT is more thanGPA and AGE. Hencethe relationship between GPA and SAT score is stronger than therelationship between GPA and AGE.The result is as expected as GPA and SAT both being relatedto scores are more correlated to eachother than AGE.b)Create and paste in a scatterplot that compares Final Exam Score and Project Score.What is the correlation (r-value)? How would you describe the correlation (positive,negative, strong, weak, medium, none)? Include the “trendline” and “equation of thetrendine” as part of your scatterplot.

Page 2

MM207 Unit 9 Final Project Assignment and Template Kaplan University - Page 2 preview image

Loading page image...

Page 3

MM207 Unit 9 Final Project Assignment and Template Kaplan University - Page 3 preview image

Loading page image...

MM207 Unit 9 Final ProjectAssignment and TemplateThe correlation (r-value) = sqrt(.1429) = .378The correlation is positive hence project score and final score both have similarbehavior, that is both of them increases or decreases together. But the strength of therelationship between the two is week as the r-value is close to 0 than 1.c)Using the equation from your above scatterplot trendline, predict (estimate) theProjectscore for a person who gets a final exam score of 82. Show all of your work.y = 0.2836x + 54.747So, the project score of a person whose final exam score 82 isy = 0.2836*82+ 54.747= 78.0022.Comparing and Describing DataFor the Final Exam Score and then for the Project Score, calculate the mean, median,mode, range, standard deviation, and variance. (Hint: remember to use the sample std devand sample variance).Final examProjecty = 0.2836x + 54.747R² = 0.1429020406080100120020406080100120Project scoreFinal exam score
Preview Mode

This document has 9 pages. Sign in to access the full document!

Study Now!

XY-Copilot AI
Unlimited Access
Secure Payment
Instant Access
24/7 Support
Document Chat

Related Documents

View all