Solution Manual For Introduction To Management Science, 12th Edition

Prepare better with Solution Manual For Introduction To Management Science, 12th Edition, a solutions manual that breaks down complex textbook problems.

Lucy Gray
Contributor
4.9
46
5 months ago
Preview (16 of 448 Pages)
100%
Purchase to unlock

Page 1

Solution Manual For Introduction To Management Science, 12th Edition - Page 1 preview image

Loading page image...

Solution ManualForIntroduction to Management ScienceTwelfth EditionBernard W. Taylor IIIVirginia Polytechnic Institute and State University

Page 2

Solution Manual For Introduction To Management Science, 12th Edition - Page 2 preview image

Loading page image...

Page 3

Solution Manual For Introduction To Management Science, 12th Edition - Page 3 preview image

Loading page image...

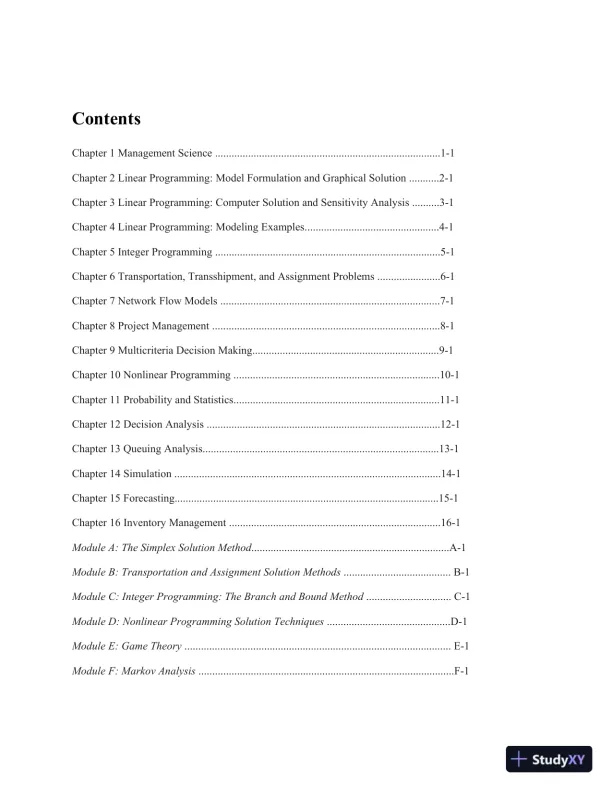
ContentsChapter 1 Management Science ..................................................................................1-1Chapter 2 Linear Programming: Model Formulation and Graphical Solution ...........2-1Chapter 3 Linear Programming: Computer Solution and Sensitivity Analysis ..........3-1Chapter 4 Linear Programming: Modeling Examples.................................................4-1Chapter 5 Integer Programming ..................................................................................5-1Chapter 6 Transportation, Transshipment, and Assignment Problems .......................6-1Chapter 7 Network Flow Models ................................................................................7-1Chapter 8 Project Management ...................................................................................8-1Chapter 9 Multicriteria Decision Making....................................................................9-1Chapter 10 Nonlinear Programming ...........................................................................10-1Chapter 11 Probability and Statistics...........................................................................11-1Chapter 12 Decision Analysis .....................................................................................12-1Chapter 13 Queuing Analysis......................................................................................13-1Chapter 14 Simulation .................................................................................................14-1Chapter 15 Forecasting................................................................................................15-1Chapter 16 Inventory Management .............................................................................16-1Module A: The Simplex Solution Method........................................................................A-1Module B: Transportation and Assignment Solution Methods....................................... B-1Module C: Integer Programming: The Branch and Bound Method............................... C-1Module D: Nonlinear Programming Solution Techniques.............................................D-1Module E: Game Theory................................................................................................. E-1Module F: Markov Analysis.............................................................................................F-1

Page 4

Solution Manual For Introduction To Management Science, 12th Edition - Page 4 preview image

Loading page image...

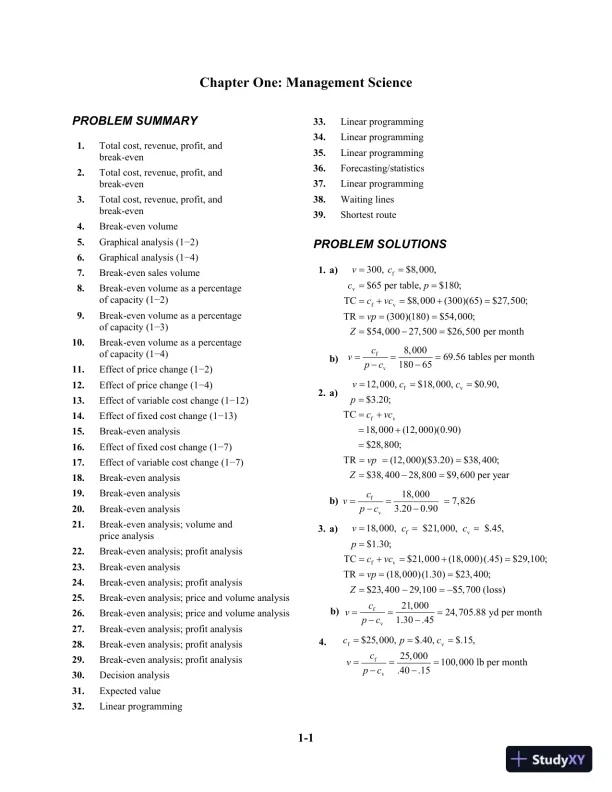
1-1Chapter One: Management SciencePROBLEM SUMMARY1.Total cost, revenue, profit, andbreak-even2.Total cost, revenue, profit, andbreak-even3.Total cost, revenue, profit, andbreak-even4.Break-even volume5.Graphical analysis (12)6.Graphical analysis (14)7.Break-even sales volume8.Break-even volume as a percentageof capacity (12)9.Break-even volume as a percentageof capacity (13)10.Break-even volume as a percentageof capacity (14)11.Effect of price change (12)12.Effect of price change (14)13.Effect of variable cost change (112)14.Effect of fixed cost change (113)15.Break-even analysis16.Effect of fixed cost change (17)17.Effect of variable cost change (17)18.Break-even analysis19.Break-even analysis20.Break-even analysis21.Break-even analysis; volume andprice analysis22.Break-even analysis; profit analysis23.Break-even analysis24.Break-even analysis; profit analysis25.Break-even analysis; price and volume analysis26.Break-even analysis; price and volume analysis27.Break-even analysis; profit analysis28.Break-even analysis; profit analysis29.Break-even analysis; profit analysis30.Decision analysis31.Expected value32.Linear programming33.Linear programming34.Linear programming35.Linear programming36.Forecasting/statistics37.Linear programming38.Waiting lines39.Shortest routePROBLEM SOLUTIONS1. a)=====+=+======fvfv300,$8,000,$65 per table,$180;TC$8,000(300)(65)$27,500;TR(300)(180)$54,000;$54,00027,500$26,500 per monthvccpcvcvpZb)fv8,00069.56 tables per month18065cvpc===2. a)fvfv12, 000,$18, 000,$0.90,$3.20;TC18, 000(12, 000)(0.90)$28,800;TR(12, 000)($3.20)$38, 400;$38, 40028,800$9, 600 per yearvccpcvcvpZ=====+=+======b)fv18, 0007,8263.200.90===cvpc3. a)=====+=+====== −fvfv18,000,$21,000,$.45,$1.30;TC$21,000(18,000)(.45)$29,100;TR(18,000)(1.30)$23, 400;$23, 40029,100$5,700 (loss)vccpcvcvpZb)4.======fvfv$25,000,$.40,$.15,25,000100,000 lb per month.40.15cpccvpcfv21,00024,705.88 yd per month1.30.45cvpc===

Page 5

Solution Manual For Introduction To Management Science, 12th Edition - Page 5 preview image

Loading page image...

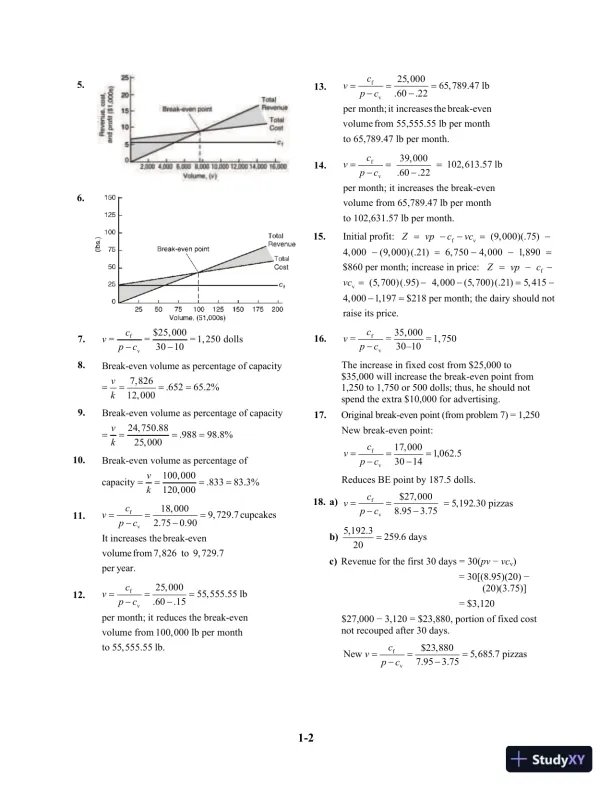
1-25.6.7.fv$25,000=== 1,250 dolls3010cvpc8.Break-even volume as percentage of capacity7,826.65265.2%12, 000====vk9.====Break-even volume as percentage of capacity24,750.88.98898.8%25,000vk10.====Break-even volume as percentage of100,000capacity.83383.3%120,000vk11.fv18, 0009, 729.7 cupcakes2.750.90It increases the break-evenvolume from 7,826 to 9, 729.7per year.cvpc===12.===fv25,00055,555.55 lb.60.15per month; it reduces the break-evenvolume from 100,000 lb per monthto 55,555.55 lb.cvpc13.fv25,00065,789.47 lb.60.22per month; it increases the break-evenvolume from 55,555.55 lb per monthto 65,789.47 lb per month.cvpc===14.===fv39,000102,613.57 lb.60.22per month; it increases the break-evenvolume from 65,789.47 lb per monthto 102,631.57 lb per month.cvpc15.fvfvInitial profit:(9,000)(.75)4,000(9,000)(.21)6,7504,0001,890$860 per month; increase in price:(5,700)(.95)4,000(5,700)(.21)5, 4154,0001,197$218 per month; the dairZvpcvcZvpcvc========y should notraise its price.16.fv35,000=== 1,75030–10cvpcThe increase in fixed cost from $25,000 to$35,000 will increase the break-even point from1,250 to 1,750 or 500 dolls; thus, he should notspend the extra $10,000 for advertising.17.Original break-even point (from problem 7) = 1,250New break-even point:===fv17,0001,062.53014cvpcReduces BE point by 187.5 dolls.18. a)===fv$27,0005,192.30 pizzas8.953.75cvpcb)=5,192.3259.6 days20c)Revenue for the first 30 days = 30(pvvcv)= 30[(8.95)(20)(20)(3.75)]= $3,120$27,0003,120 = $23,880, portion of fixed costnot recouped after 30 days.===fv$23,880New5,685.7 pizzas7.953.75cvpc

Page 6

Solution Manual For Introduction To Management Science, 12th Edition - Page 6 preview image

Loading page image...

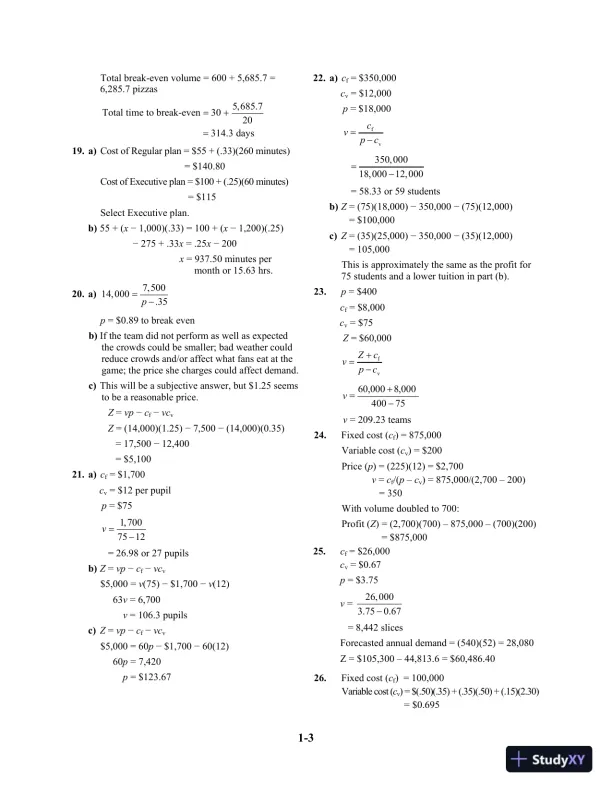
1-3Total break-even volume = 600 + 5,685.7 =6,285.7 pizzas5,685.7Total time to break-even3020314.3 days=+=19. a)Cost of Regular plan = $55 + (.33)(260 minutes)= $140.80Cost of Executive plan = $100 + (.25)(60 minutes)= $115Select Executive plan.b)55 + (x1,000)(.33) = 100 + (x1,200)(.25)275 + .33x= .25x200x= 937.50 minutes permonth or 15.63 hrs.20. a)=7,50014,000.35pp= $0.89 to break evenb)If the team did not perform as well as expectedthe crowds could be smaller; bad weather couldreduce crowds and/or affect what fans eat at thegame; the price she charges could affect demand.c)This will be a subjective answer, but $1.25 seemsto be a reasonable price.Z=vpcfvcvZ= (14,000)(1.25)7,500(14,000)(0.35)= 17,50012,400= $5,10021. a)cf= $1,700cv= $12 per pupilp= $75=1,7007512v= 26.98 or 27 pupilsb)Z=vpcfvcv$5,000 =v(75)$1,700v(12)63v= 6,700v= 106.3 pupilsc)Z=vpcfvcv$5,000 = 60p$1,70060(12)60p= 7,420p= $123.6722. a)cf= $350,000cv= $12,000p= $18,000=fvcvpc=350,00018,00012,000= 58.33 or 59 studentsb)Z= (75)(18,000)350,000(75)(12,000)= $100,000c)Z= (35)(25,000)350,000(35)(12,000)= 105,000This is approximately the same as the profit for75 students and a lower tuition in part (b).23.p= $400cf= $8,000cv= $75Z= $60,000+=fvZcvpc+=60,0008,00040075vv= 209.23 teams24.Fixed cost (cf) = 875,000Variable cost (cv) = $200Price (p) = (225)(12) = $2,700v=cf/(pcv) = 875,000/(2,700 – 200)= 350With volume doubled to 700:Profit (Z) = (2,700)(700) – 875,000 – (700)(200)= $875,00025.cf= $26,000cv= $0.67p= $3.75v=26, 0003.750.67= 8,442 slicesForecasted annual demand = (540)(52) = 28,080Z = $105,300 – 44,813.6 = $60,486.4026.Fixed cost (cf) = 100,000Variable cost (cv) = $(.50)(.35) + (.35)(.50) + (.15)(2.30)= $0.695

Page 7

Solution Manual For Introduction To Management Science, 12th Edition - Page 7 preview image

Loading page image...

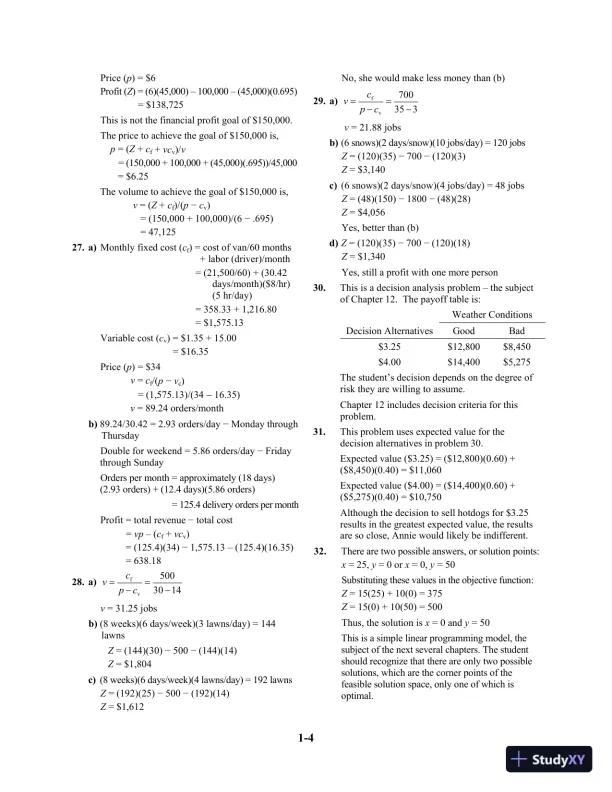
1-4Price (p) = $6Profit (Z) = (6)(45,000) – 100,000 – (45,000)(0.695)= $138,725This is not the financial profit goal of $150,000.The price to achieve the goal of $150,000 is,p= (Z+cf+vcv)/v= (150,000 + 100,000 + (45,000)(.695))/45,000= $6.25The volume to achieve the goal of $150,000 is,v= (Z+cf)/(pcv)= (150,000 + 100,000)/(6.695)= 47,12527. a)Monthly fixed cost (cf) = cost of van/60 months+ labor (driver)/month= (21,500/60) + (30.42days/month)($8/hr)(5 hr/day)= 358.33 + 1,216.80= $1,575.13Variable cost (cv) = $1.35 + 15.00= $16.35Price (p) = $34v=cf/(pvc)= (1,575.13)/(3416.35)v= 89.24 orders/monthb)89.24/30.42 = 2.93 orders/dayMonday throughThursdayDouble for weekend = 5.86 orders/dayFridaythrough SundayOrders per month = approximately (18 days)(2.93 orders) + (12.4 days)(5.86 orders)= 125.4 delivery orders per monthProfit = total revenuetotal cost=vp– (cf+vcv)= (125.4)(34)1,575.13 – (125.4)(16.35)= 638.1828. a)==fv5003014cvpcv= 31.25 jobsb)(8 weeks)(6 days/week)(3 lawns/day) = 144lawnsZ= (144)(30)500(144)(14)Z= $1,804c)(8 weeks)(6 days/week)(4 lawns/day) = 192 lawnsZ= (192)(25)500(192)(14)Z= $1,612No, she would make less money than (b)29. a)==fv700353cvpcv= 21.88 jobsb)(6 snows)(2 days/snow)(10 jobs/day) = 120 jobsZ= (120)(35)700(120)(3)Z= $3,140c)(6 snows)(2 days/snow)(4 jobs/day) = 48 jobsZ= (48)(150)1800(48)(28)Z= $4,056Yes, better than (b)d)Z= (120)(35)700(120)(18)Z= $1,340Yes, still a profit with one more person30.This is a decision analysis problem – the subjectof Chapter 12. The payoff table is:Weather ConditionsDecision AlternativesGoodBad$3.25$12,800$8,450$4.00$14,400$5,275The student’s decision depends on the degree ofrisk they are willing to assume.Chapter 12 includes decision criteria for thisproblem.31.This problem uses expected value for thedecision alternatives in problem 30.Expected value ($3.25) = ($12,800)(0.60) +($8,450)(0.40) = $11,060Expected value ($4.00) = ($14,400)(0.60) +($5,275)(0.40) = $10,750Although the decision to sell hotdogs for $3.25results in the greatest expected value, the resultsare so close, Annie would likely be indifferent.32.There are two possible answers, or solution points:x= 25,y= 0 orx= 0,y= 50Substituting these values in the objective function:Z= 15(25) + 10(0) = 375Z= 15(0) + 10(50) = 500Thus, the solution isx= 0 andy= 50This is a simple linear programming model, thesubject of the next several chapters. The studentshould recognize that there are only two possiblesolutions, which are the corner points of thefeasible solution space, only one of which isoptimal.

Page 8

Solution Manual For Introduction To Management Science, 12th Edition - Page 8 preview image

Loading page image...

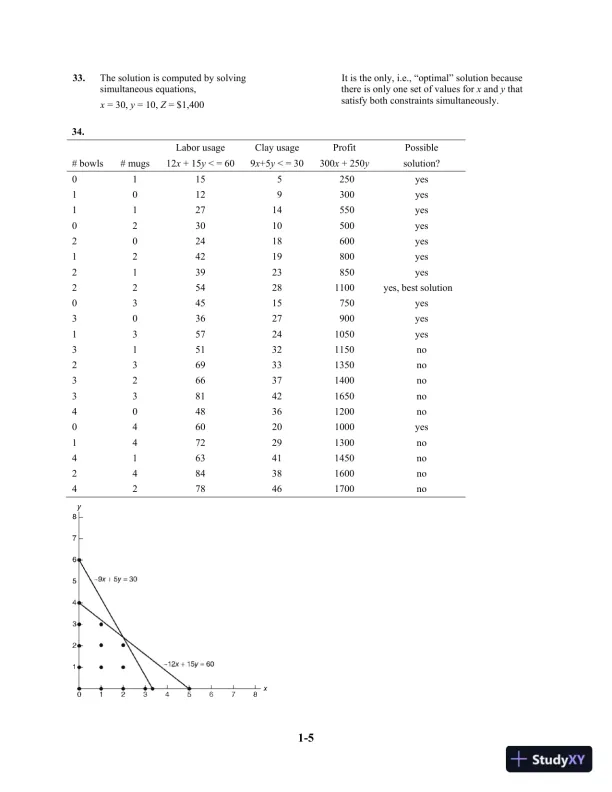
1-533.The solution is computed by solvingsimultaneous equations,x= 30,y= 10,Z= $1,400It is the only, i.e., “optimal” solution becausethere is only one set of values forxandythatsatisfy both constraints simultaneously.34.Labor usageClay usageProfitPossible# bowls# mugs12x+ 15y< = 609x+5y< = 30300x+ 250ysolution?01155250yes10129300yes112714550yes023010500yes202418600yes124219800yes213923850yes2254281100yes, best solution034515750yes303627900yes1357241050yes3151321150no2369331350no3266371400no3381421650no4048361200no0460201000yes1472291300no4163411450no2484381600no4278461700no

Page 9

Solution Manual For Introduction To Management Science, 12th Edition - Page 9 preview image

Loading page image...

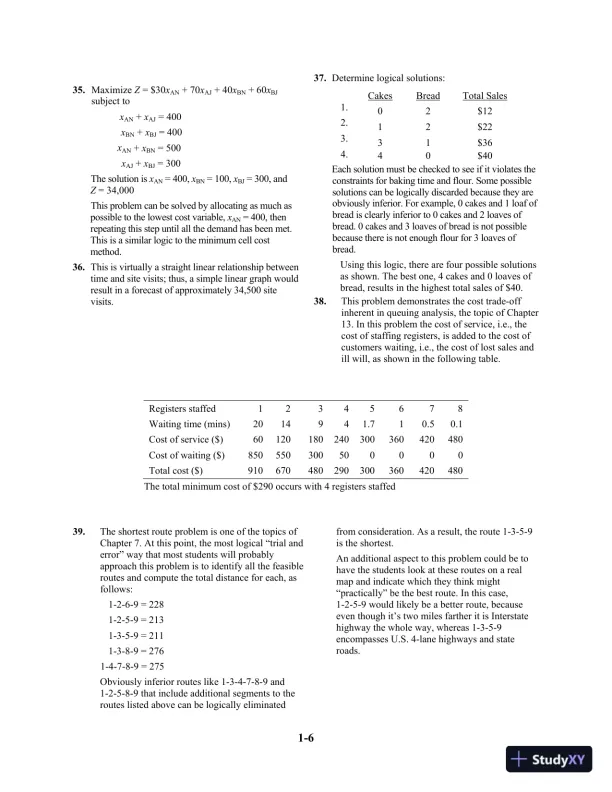
1-635.MaximizeZ= $30xAN+ 70xAJ+ 40xBN+ 60xBJsubject toxAN+xAJ= 400xBN+xBJ= 400xAN+xBN= 500xAJ+xBJ= 300The solution isxAN= 400,xBN= 100,xBJ= 300, andZ= 34,000This problem can be solved by allocating as much aspossible to the lowest cost variable,xAN= 400, thenrepeating this step until all the demand has been met.This is a similar logic to the minimum cell costmethod.36.This is virtually a straight linear relationship betweentime and site visits; thus, a simple linear graph wouldresult in a forecast of approximately 34,500 sitevisits.37.Determine logical solutions:CakesBreadTotal Sales1.02$122.12$223.31$364.40$40Each solution must be checked to see if it violates theconstraints for baking time and flour. Some possiblesolutions can be logically discarded because they areobviously inferior. For example, 0 cakes and 1 loaf ofbread is clearly inferior to 0 cakes and 2 loaves ofbread. 0 cakes and 3 loaves of bread is not possiblebecause there is not enough flour for 3 loaves ofbread.Using this logic, there are four possible solutionsas shown. The best one, 4 cakes and 0 loaves ofbread, results in the highest total sales of $40.38.This problem demonstrates the cost trade-offinherent in queuing analysis, the topic of Chapter13. In this problem the cost of service, i.e., thecost of staffing registers, is added to the cost ofcustomers waiting, i.e., the cost of lost sales andill will, as shown in the following table.Registers staffed12345678Waiting time (mins)2014941.710.50.1Cost of service ($)60120180240300360420480Cost of waiting ($)850550300500000Total cost ($)910670480290300360420480The total minimum cost of $290 occurs with 4 registers staffed39.The shortest route problem is one of the topics ofChapter 7. At this point, the most logical “trial anderror” way that most students will probablyapproach this problem is to identify all the feasibleroutes and compute the total distance for each, asfollows:1-2-6-9 = 2281-2-5-9 = 2131-3-5-9 = 2111-3-8-9 = 2761-4-7-8-9 = 275Obviously inferior routes like 1-3-4-7-8-9 and1-2-5-8-9 that include additional segments to theroutes listed above can be logically eliminatedfrom consideration. As a result, the route 1-3-5-9is the shortest.An additional aspect to this problem could be tohave the students look at these routes on a realmap and indicate which they think might“practically” be the best route. In this case,1-2-5-9 would likely be a better route, becauseeven though it’s two miles farther it is Interstatehighway the whole way, whereas 1-3-5-9encompasses U.S. 4-lane highways and stateroads.

Page 10

Solution Manual For Introduction To Management Science, 12th Edition - Page 10 preview image

Loading page image...

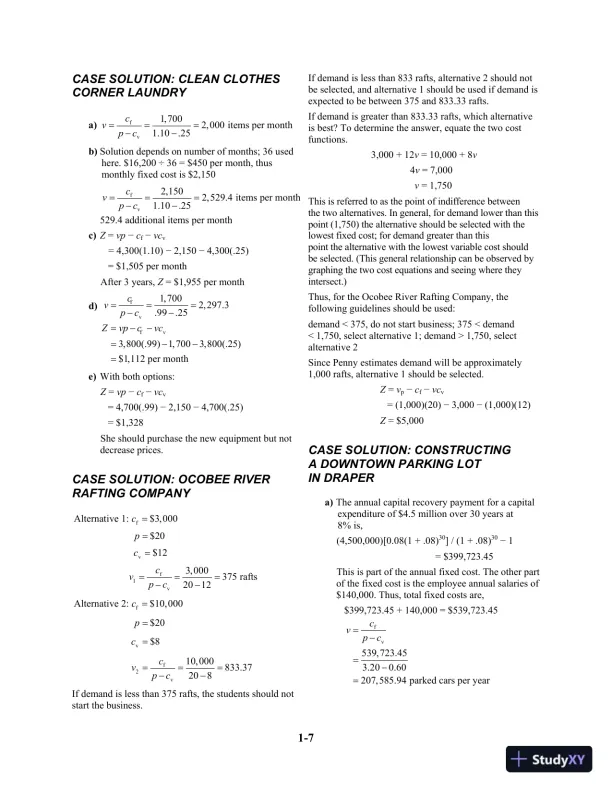
1-7CASE SOLUTION: CLEAN CLOTHESCORNER LAUNDRYa)===fv1,7002,000 items per month1.10.25cvpcb)Solution depends on number of months; 36 usedhere. $16,200 ÷ 36 = $450 per month, thusmonthly fixed cost is $2,150===fv2,1502,529.4 items per month1.10.25cvpc529.4 additional items per monthc)Z=vpcfvcv= 4,300(1.10)2,1504,300(.25)= $1,505 per monthAfter 3 years,Z= $1,955 per monthd)======fvfv1,7002,297.3.99.253,800(.99)1,7003,800(.25)$1,112 per monthcvpcZvpcvce)With both options:Z=vpcfvcv= 4,700(.99)2,1504,700(.25)= $1,328She should purchase the new equipment but notdecrease prices.CASE SOLUTION: OCOBEE RIVERRAFTING COMPANY=fAlternative 1:$3,000c=$20p=v$12c===f1v3,000375 rafts2012cvpc=fAlternative 2:$10,000c=$20p=v$8c===f2v10,000833.37208cvpcIf demand is less than 375 rafts, the students should notstart the business.If demand is less than 833 rafts, alternative 2 should notbe selected, and alternative 1 should be used if demand isexpected to be between 375 and 833.33 rafts.If demand is greater than 833.33 rafts, which alternativeis best? To determine the answer, equate the two costfunctions.3,000 + 12v= 10,000 + 8v4v= 7,000v= 1,750This is referred to as the point of indifference betweenthe two alternatives. In general, for demand lower than thispoint (1,750) the alternative should be selected with thelowest fixed cost; for demand greater than thispoint the alternative with the lowest variable cost shouldbe selected. (This general relationship can be observed bygraphing the two cost equations and seeing where theyintersect.)Thus, for the Ocobee River Rafting Company, thefollowing guidelines should be used:demand < 375, do not start business; 375 < demand< 1,750, select alternative 1; demand > 1,750, selectalternative 2Since Penny estimates demand will be approximately1,000 rafts, alternative 1 should be selected.Z=vpcfvcv= (1,000)(20)3,000(1,000)(12)Z= $5,000CASE SOLUTION: CONSTRUCTINGA DOWNTOWN PARKING LOTIN DRAPERa)The annual capital recovery payment for a capitalexpenditure of $4.5 million over 30 years at8% is,(4,500,000)[0.08(1 + .08)30] / (1 + .08)301= $399,723.45This is part of the annual fixed cost. The other partof the fixed cost is the employee annual salaries of$140,000. Thus, total fixed costs are,$399,723.45 + 140,000 = $539,723.45===fv539,723.453.200.60207,585.94 parked cars per yearcvpc

Page 11

Solution Manual For Introduction To Management Science, 12th Edition - Page 11 preview image

Loading page image...

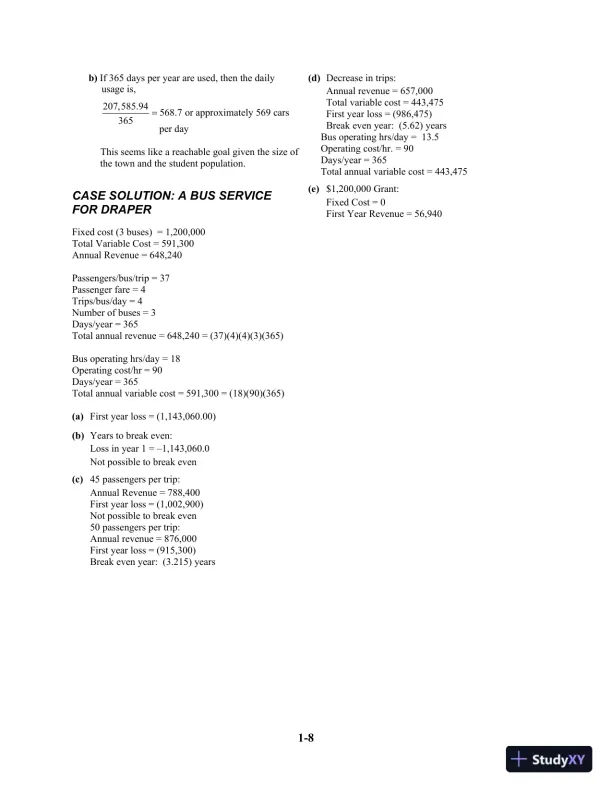
1-8b)If 365 days per year are used, then the dailyusage is,207,585.94568.7 or approximately 569 cars365per day=This seems like a reachable goal given the size ofthe town and the student population.CASE SOLUTION: A BUS SERVICEFOR DRAPERFixed cost (3 buses) = 1,200,000Total Variable Cost = 591,300Annual Revenue = 648,240Passengers/bus/trip = 37Passenger fare = 4Trips/bus/day = 4Number of buses = 3Days/year = 365Total annual revenue = 648,240 = (37)(4)(4)(3)(365)Bus operating hrs/day = 18Operating cost/hr = 90Days/year = 365Total annual variable cost = 591,300 = (18)(90)(365)(a)First year loss = (1,143,060.00)(b)Years to break even:Loss in year 1 = –1,143,060.0Not possible to break even(c)45 passengers per trip:Annual Revenue = 788,400First year loss = (1,002,900)Not possible to break even50 passengers per trip:Annual revenue = 876,000First year loss = (915,300)Break even year: (3.215) years(d)Decrease in trips:Annual revenue = 657,000Total variable cost = 443,475First year loss = (986,475)Break even year: (5.62) yearsBus operating hrs/day = 13.5Operating cost/hr. = 90Days/year = 365Total annual variable cost = 443,475(e)$1,200,000 Grant:Fixed Cost = 0First Year Revenue = 56,940

Page 12

Solution Manual For Introduction To Management Science, 12th Edition - Page 12 preview image

Loading page image...

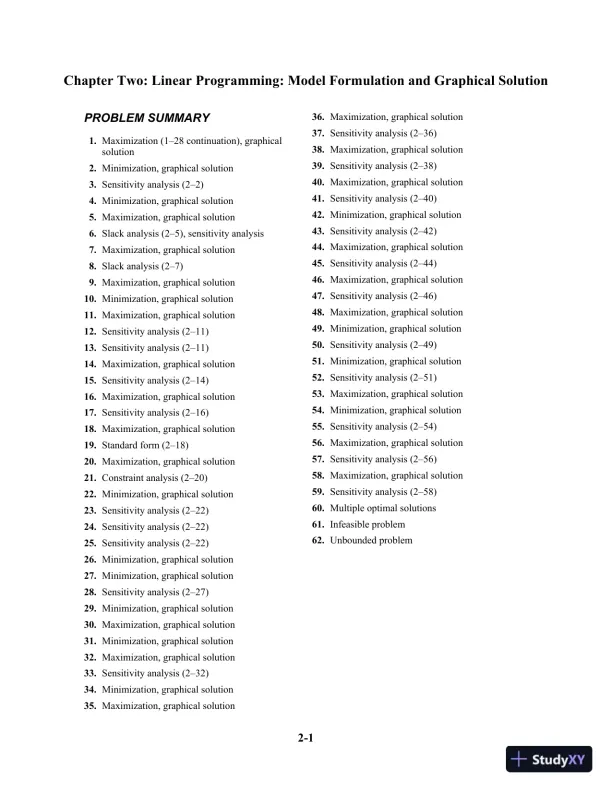
2-1Chapter Two: Linear Programming: Model Formulation and Graphical SolutionPROBLEMSUMMARY1.Maximization (1–28 continuation), graphicalsolution2.Minimization, graphical solution3.Sensitivity analysis (2–2)4.Minimization, graphical solution5.Maximization, graphical solution6.Slack analysis (2–5), sensitivity analysis7.Maximization, graphical solution8.Slack analysis (2–7)9.Maximization, graphical solution10.Minimization, graphical solution11.Maximization, graphical solution12.Sensitivity analysis (2–11)13.Sensitivity analysis (2–11)14.Maximization, graphical solution15.Sensitivity analysis (2–14)16.Maximization, graphical solution17.Sensitivity analysis (2–16)18.Maximization, graphical solution19.Standard form (2–18)20.Maximization, graphical solution21.Constraint analysis (2–20)22.Minimization, graphical solution23.Sensitivity analysis (2–22)24.Sensitivity analysis (2–22)25.Sensitivity analysis (2–22)26.Minimization, graphical solution27.Minimization, graphical solution28.Sensitivity analysis (2–27)29.Minimization, graphical solution30.Maximization, graphical solution31.Minimization, graphical solution32.Maximization, graphical solution33.Sensitivity analysis (2–32)34.Minimization, graphical solution35.Maximization, graphical solution36.Maximization, graphical solution37.Sensitivity analysis (2–36)38.Maximization, graphical solution39.Sensitivity analysis (2–38)40.Maximization, graphical solution41.Sensitivity analysis (2–40)42.Minimization, graphical solution43.Sensitivity analysis (2–42)44.Maximization, graphical solution45.Sensitivity analysis (2–44)46.Maximization, graphical solution47.Sensitivity analysis (2–46)48.Maximization, graphical solution49.Minimization, graphical solution50.Sensitivity analysis (2–49)51.Minimization, graphical solution52.Sensitivity analysis (2–51)53.Maximization, graphical solution54.Minimization, graphical solution55.Sensitivity analysis (2–54)56.Maximization, graphical solution57.Sensitivity analysis (2–56)58.Maximization, graphical solution59.Sensitivity analysis (2–58)60.Multiple optimal solutions61.Infeasible problem62.Unbounded problem

Page 13

Solution Manual For Introduction To Management Science, 12th Edition - Page 13 preview image

Loading page image...

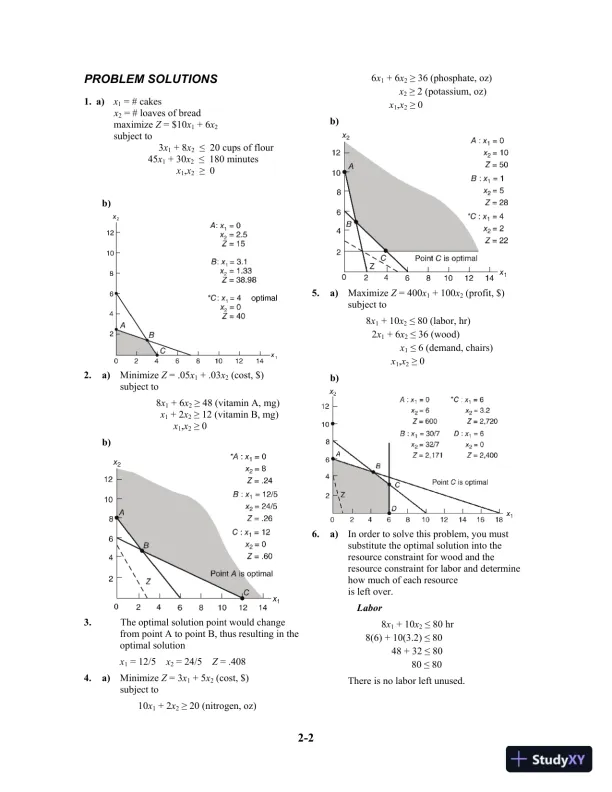
2-2PROBLEMSOLUTIONS1. a)x1= # cakesx2= # loaves of breadmaximizeZ= $10x1+ 6x2subject to3x1+ 8x220 cups of flour45x1+ 30x2180 minutesx1,x20b)2.a)MinimizeZ= .05x1+ .03x2(cost, $)subject to8x1+ 6x248 (vitamin A, mg)x1+ 2x212 (vitamin B, mg)x1,x20b)3.The optimal solution point would changefrom point A to point B, thus resulting in theoptimal solutionx1= 12/5x2= 24/5Z= .4084.a)MinimizeZ= 3x1+ 5x2(cost, $)subject to10x1+ 2x220 (nitrogen, oz)6x1+ 6x236 (phosphate, oz)x22 (potassium, oz)x1,x20b)5.a)MaximizeZ= 400x1+ 100x2(profit, $)subject to8x1+ 10x280 (labor, hr)2x1+ 6x236 (wood)x16 (demand, chairs)x1,x20b)6.a)In order to solve this problem, you mustsubstitute the optimal solution into theresource constraint for wood and theresource constraint for labor and determinehow much of each resourceis left over.Labor8x1+ 10x280 hr8(6) + 10(3.2)8048 + 32808080There is no labor left unused.

Page 14

Solution Manual For Introduction To Management Science, 12th Edition - Page 14 preview image

Loading page image...

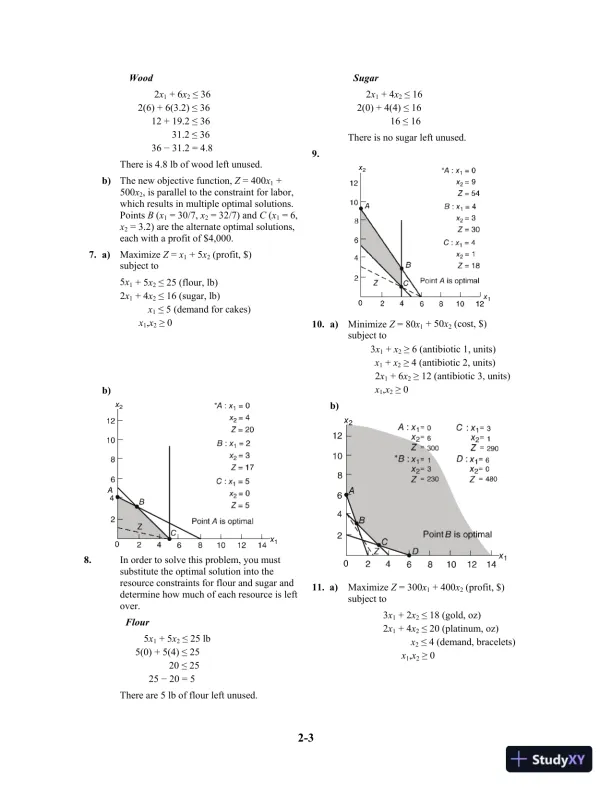
2-3Wood2x1+ 6x2362(6) + 6(3.2)3612 + 19.23631.2363631.2 = 4.8There is 4.8 lb of wood left unused.b)The new objective function,Z= 400x1+500x2, is parallel to the constraint for labor,which results in multiple optimal solutions.PointsB(x1= 30/7,x2= 32/7) andC(x1= 6,x2= 3.2) are the alternate optimal solutions,each with a profit of $4,000.7.a)MaximizeZ=x1+ 5x2(profit, $)subject to5x1+ 5x225 (flour, lb)2x1+ 4x216 (sugar, lb)x15 (demand for cakes)x1,x20b)8.In order to solve this problem, you mustsubstitute the optimal solution into theresource constraints for flour and sugar anddetermine how much of each resource is leftover.Flour5x1+ 5x225 lb5(0) + 5(4)2520252520 = 5There are 5 lb of flour left unused.Sugar2x1+ 4x2162(0) + 4(4)161616There is no sugar left unused.9.10.a)MinimizeZ= 80x1+ 50x2(cost, $)subject to3x1+x26 (antibiotic 1, units)x1+x24 (antibiotic 2, units)2x1+ 6x212 (antibiotic 3, units)x1,x20b)11.a)MaximizeZ= 300x1+ 400x2(profit, $)subject to3x1+ 2x218 (gold, oz)2x1+ 4x220 (platinum, oz)x24 (demand, bracelets)x1,x20

Page 15

Solution Manual For Introduction To Management Science, 12th Edition - Page 15 preview image

Loading page image...

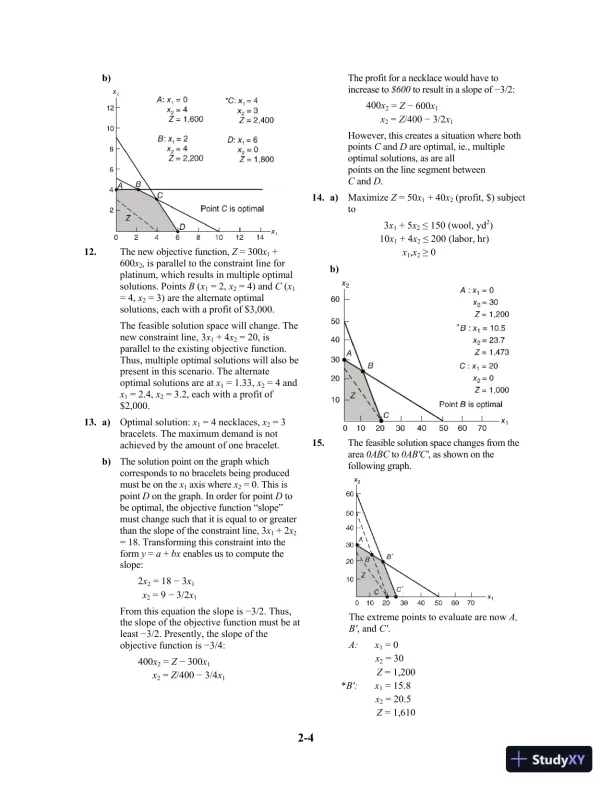
2-4b)12.The new objective function,Z= 300x1+600x2, is parallel to the constraint line forplatinum, which results in multiple optimalsolutions. PointsB(x1= 2,x2= 4) andC(x1= 4,x2= 3) are the alternate optimalsolutions, each with a profit of $3,000.The feasible solution space will change. Thenew constraint line, 3x1+ 4x2= 20, isparallel to the existing objective function.Thus, multiple optimal solutions will also bepresent in this scenario. The alternateoptimal solutions are atx1= 1.33,x2= 4 andx1= 2.4,x2= 3.2, each with a profit of$2,000.13.a)Optimal solution:x1= 4 necklaces,x2= 3bracelets. The maximum demand is notachieved by the amount of one bracelet.b)The solution point on the graph whichcorresponds to no bracelets being producedmust be on thex1axis wherex2= 0. This ispointDon the graph. In order for pointDtobe optimal, the objective function “slope”must change such that it is equal to or greaterthan the slope of the constraint line, 3x1+ 2x2= 18. Transforming this constraint into theformy=a+bxenables us to compute theslope:2x2= 183x1x2= 93/2x1From this equation the slope is3/2. Thus,the slope of the objective function must be atleast3/2. Presently, the slope of theobjective function is3/4:400x2=Z300x1x2=Z/4003/4x1The profit for a necklace would have toincrease to$600to result in a slope of3/2:400x2=Z600x1x2=Z/4003/2x1However, this creates a situation where bothpointsCandDare optimal, ie., multipleoptimal solutions, as are allpoints on the line segment betweenCandD.14. a)MaximizeZ= 50x1+ 40x2(profit, $) subjectto3x1+ 5x2150 (wool, yd2)10x1+ 4x2200 (labor, hr)x1,x20b)15.The feasible solution space changes from thearea0ABCto0AB'C', as shown on thefollowing graph.The extreme points to evaluate are nowA,B', andC'.A:x1= 0x2= 30Z= 1,200*B':x1= 15.8x2= 20.5Z= 1,610

Page 16

Solution Manual For Introduction To Management Science, 12th Edition - Page 16 preview image

Loading page image...

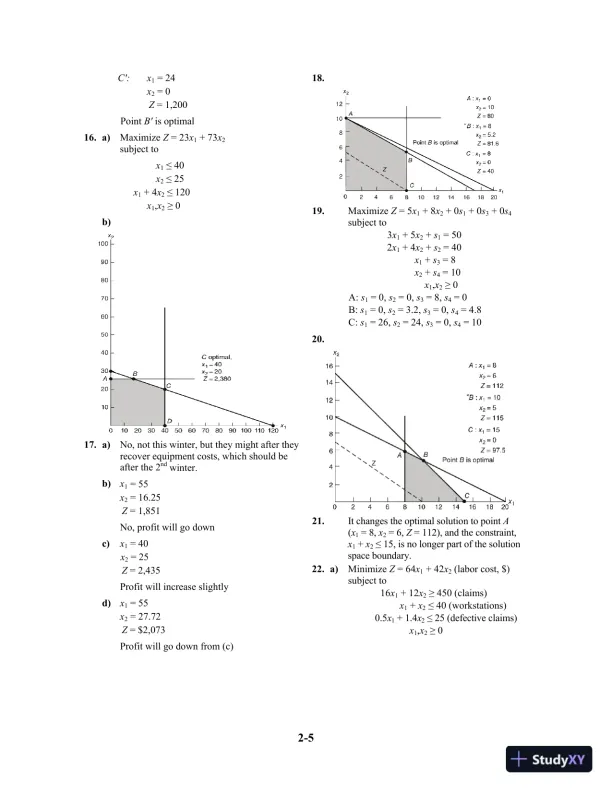
2-5C':x1= 24x2= 0Z= 1,200PointB'is optimal16. a)MaximizeZ= 23x1+ 73x2subject tox140x225x1+ 4x2120x1,x20b)17. a)No, not this winter, but they might after theyrecover equipment costs, which should beafter the 2ndwinter.b)x1= 55x2= 16.25Z= 1,851No, profit will go downc)x1= 40x2= 25Z= 2,435Profit will increase slightlyd)x1= 55x2= 27.72Z= $2,073Profit will go down from (c)18.19.MaximizeZ= 5x1+ 8x2+ 0s1+ 0s3+ 0s4subject to3x1+ 5x2+s1= 502x1+ 4x2+s2= 40x1+s3= 8x2+s4= 10x1,x20A:s1= 0,s2= 0,s3= 8,s4= 0B:s1= 0,s2= 3.2,s3= 0,s4= 4.8C:s1= 26,s2= 24,s3= 0,s4= 1020.21.It changes the optimal solution to pointA(x1= 8,x2= 6,Z= 112), and the constraint,x1+x215, is no longer part of the solutionspace boundary.22.a)MinimizeZ= 64x1+ 42x2(labor cost, $)subject to16x1+ 12x2450 (claims)x1+x240 (workstations)0.5x1+ 1.4x225 (defective claims)x1,x20
Preview Mode

This document has 448 pages. Sign in to access the full document!

Study Now!

XY-Copilot AI
Unlimited Access
Secure Payment
Instant Access
24/7 Support
Document Chat

Document Details

Related Documents

View all