Solution Manual For Managing, Controlling, and Improving Quality, 1st Edition
Learn faster with Solution Manual For Managing, Controlling, and Improving Quality, 1st Edition, a comprehensive solution manual for effective studying.
Michael Davis
Contributor
4.9
50
about 2 months ago
Preview (31 of 113)
Sign in to access the full document!
CHAPTER 1
Introduction to Quality
Learning Objectives
After completing this chapter you should be able to:
1. Define and discuss quality and quality improvement
2. Discuss the different dimensions of quality
3. Discuss the evolution of modern quality improvement methods
4. Discuss the role that variability and statistical methods play in controlling and improving quality
5. Explain the links between quality and productivity and between quality and cost
6. Discuss product liability
Important Terms and Concepts
Acceptance-sampling
Appraisal costs
Critical-to-quality (CTQ)
Dimensions of quality
Fitness for use
Internal and external failure
costs
Nonconforming product or
service
Prevention costs
Product liability
Quality assurance
Quality characteristics
Quality control and
improvement
Quality engineering
Quality of conformance
Quality of design
Quality planning
Specifications
Variability
Exercises
1.1. Why is it difficult to define quality?
Even the American Society for Quality describes “quality” as a subjective term for which each person or
sector has its own definition. Given a large set of customers considering purchasing the same product or
service, it is likely that each customer evaluates it in terms of a completely different set of desirable
characteristics. As a result, it is extremely difficult to come up with a single definition of quality that could
meet the expectations of all customers for all products or services. (For further details refer to page 2)
1.7. What are the three primary technical tools used for quality control and improvement?
The three primary statistical technical tools include: statistical process control, design of experiments, and
acceptance-sampling.
1.10. Discuss the statement “Quality is the responsibility of the quality department.”
The responsibility for quality spans the entire organization. Quality improvement must be a total,
company-wide activity, and that every organizational unit must actively participate. Because quality
improvement activities are so broad, successful efforts require, as an initial step, senior management
commitment. This commitment involves emphasis on the importance of quality, identification of the
respective quality responsibilities of the various organizational units, and explicit accountability for quality
improvement of all managers and employees in the company. Nevertheless, the quality department takes
care of the quality planning and analyses in order to make sure all quality efforts are being successfully
implemented throughout the organization. (For further details refer to pages 26-27)
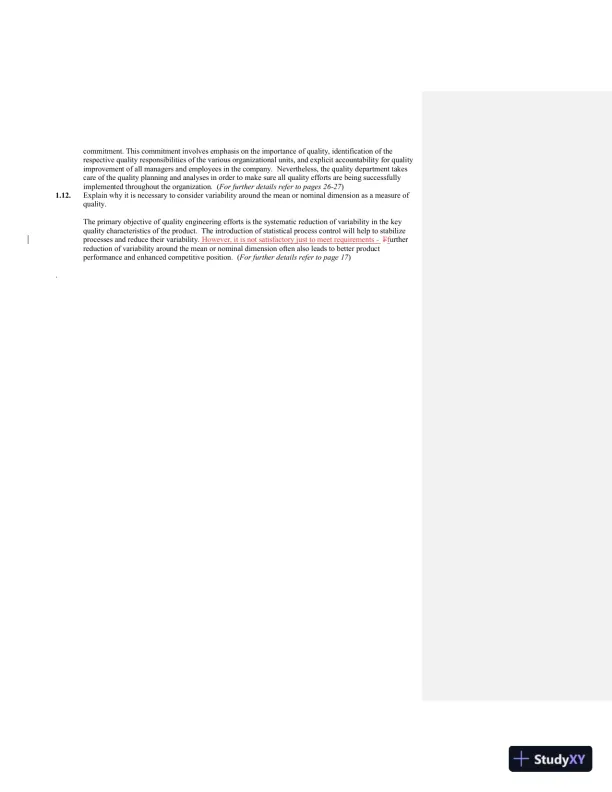
1.12. Explain why it is necessary to consider variability around the mean or nominal dimension as a measure of
quality.
The primary objective of quality engineering efforts is the systematic reduction of variability in the key
quality characteristics of the product. The introduction of statistical process control will help to stabilize
processes and reduce their variability. However, it is not satisfactory just to meet requirements - Ffurther
reduction of variability around the mean or nominal dimension often also leads to better product
performance and enhanced competitive position. (For further details refer to page 17)
.
CHAPTER 2
Managing aspects of Quality
Learning Objectives
After completing this chapter you should be able to:
1. Describe the quality management philosophies of W. Edwards Deming, Joseph M. Juran, and Armand V.
Feigenbaum
2. Discuss total quality management, six-sigma, the Malcolm Baldrige National Quality Award, and quality
systems and standards
3. Understand the importance of selecting good projects for improvement activities
4. Explain the five steps of DMAIC
5. Know when and when not to use DMAIC
Important Terms and Concepts
Analyze step
Control step
Define step
Design for Six-Sigma (DFSS)
DMAIC
Failure modes and effects analysis
(FMEA)
Improve step
Key process input variables
(KPIV)
Key process output variables
(KPOV)
Measure step
Project charter
SIPOC diagram
Six-Sigma
Tollgate
Exercises
2.12. Explain the importance of tollgates in the DMAIC process.
At a tollgate, a project team presents its work to managers and “owners” of the process. In a six-sigma
organization, the tollgate participants also would include the project champion, master black belts, and
other black belts not working directly on the project. Tollgates are where the project is reviewed to ensure
that it is on track and they provide a continuing opportunity to evaluate whether the team can successfully
complete the project on schedule. Tollgates also present an opportunity to provide guidance regarding the
use of specific technical tools and other information about the problem. Organization problems and other
barriers to success—and strategies for dealing with them—also often are identified during tollgate reviews.
Tollgates are critical to the overall problem-solving process; It is important that these reviews be conducted
very soon after the team completes each step.
2.18. Suppose that your business is operating at the four-and-a-half-sigma quality level. If projects
have an average improvement rate of 50% annually, how many years will it take to achieve six-
sigma quality?
Assuming thea 1.5
shift in the mean that is customary with six-sigma applications [𝑋′~𝑁(𝜇′ = 1.50, 𝜎 =
1)], the percentage within the −4.5𝜎 and 4.5𝜎 limits is:
Loading page 4...
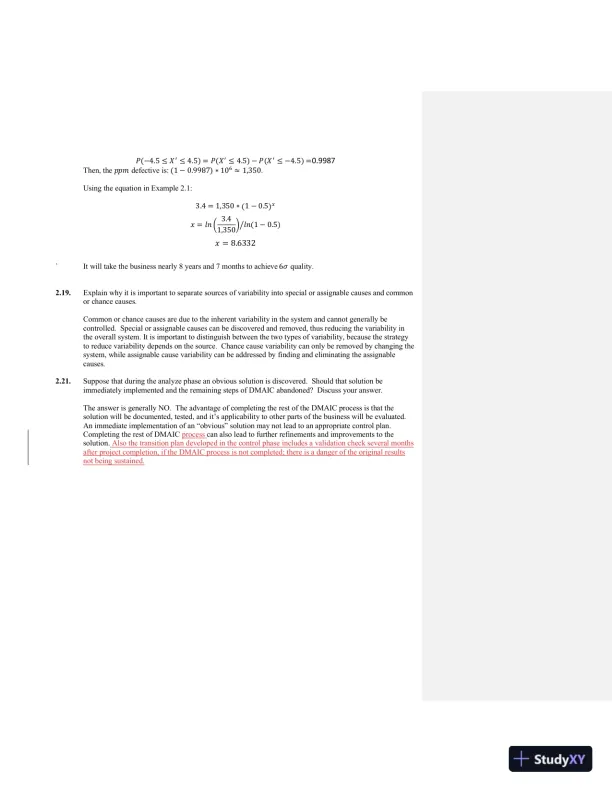
𝑃(−4.5 ≤ 𝑋′ ≤ 4.5) = 𝑃(𝑋′ ≤ 4.5) − 𝑃(𝑋′ ≤ −4.5) =0.9987
Then, the 𝑝𝑝𝑚 defective is: (1 − 0.9987) ∗ 106 ≈ 1,350.
Using the equation in Example 2.1:
3.4 = 1,350 ∗ (1 − 0.5)𝑥
𝑥 = 𝑙𝑛 ( 3.4
1,350) 𝑙𝑛(1 − 0.5)⁄
𝑥 = 8.6332
` It will take the business nearly 8 years and 7 months to achieve 6𝜎 quality.
2.19. Explain why it is important to separate sources of variability into special or assignable causes and common
or chance causes.
Common or chance causes are due to the inherent variability in the system and cannot generally be
controlled. Special or assignable causes can be discovered and removed, thus reducing the variability in
the overall system. It is important to distinguish between the two types of variability, because the strategy
to reduce variability depends on the source. Chance cause variability can only be removed by changing the
system, while assignable cause variability can be addressed by finding and eliminating the assignable
causes.
2.21. Suppose that during the analyze phase an obvious solution is discovered. Should that solution be
immediately implemented and the remaining steps of DMAIC abandoned? Discuss your answer.
The answer is generally NO. The advantage of completing the rest of the DMAIC process is that the
solution will be documented, tested, and it’s applicability to other parts of the business will be evaluated.
An immediate implementation of an “obvious” solution may not lead to an appropriate control plan.
Completing the rest of DMAIC process can also lead to further refinements and improvements to the
solution. Also the transition plan developed in the control phase includes a validation check several months
after project completion, if the DMAIC process is not completed; there is a danger of the original results
not being sustained.
Loading page 5...
CHAPTER 3
Tools and Techniques for Quality Control and Improvement
Learning Objectives
After completing this chapter you should be able to:
1. Understand chance and assignable causes of variability in a process
2. Explain the statistical basis of the Shewhart control chart
3. Understand the basic process improvement tools of SPC: the histogram or stem-and-leaf plot, the check
sheet, the Pareto chart, the cause-and-effect diagram, the defect concentration diagram, the scatter diagram,
and the control chart
4. Explain how sensitizing rules and pattern recognition are used inconjunction with control charts
Important Terms and Concepts
Action limits
Assignable causes of variation
Cause-and-effect diagram
Chance causes of variation
Check sheet
Control chart
Control limits
Defect concentration diagram
Designed experiments
Flow charts, operations process
charts, and value stream mapping
Factorial experiment
In-control process
Magnificent seven
Out-of-control-action plan
(OCAP)
Out-of-control process
Pareto chart
Patterns on control charts
Scatter diagram
Shewhart control charts
Statistical control of a process
Statistical process control (SPC)
Three-sigma control limits
Exercises
3.6. Consider the control charts shown here. Does the pattern appear random?
No, the last four samples are located at a distance greater than 1 from the center line.
Loading page 6...
3.7. Consider the control charts shown here. Does the pattern appear random?
Yes, the pattern is random.
3.8. Consider the control charts shown here. Does the pattern appear random?
Yes, the pattern is random.
3.8. Consider the control charts shown here. Does the pattern appear random?
Yes, the pattern is random.
Loading page 7...
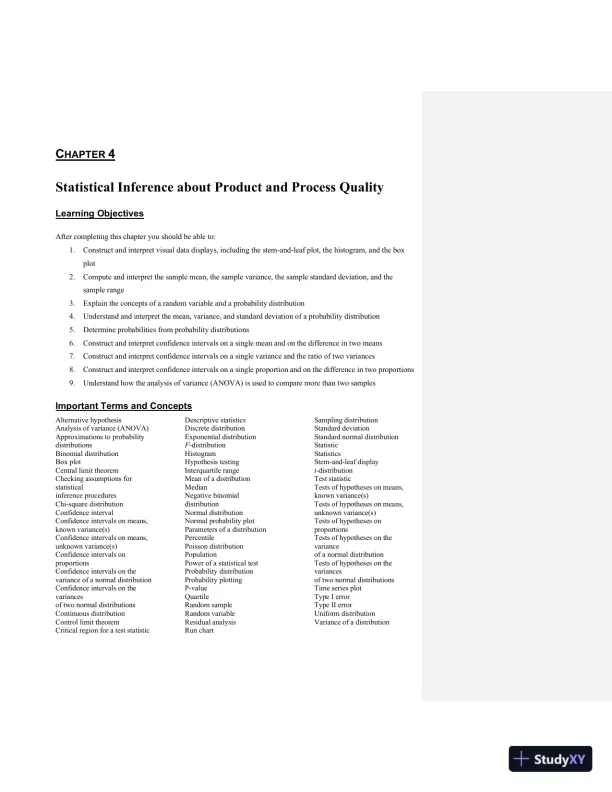
CHAPTER 4
Statistical Inference about Product and Process Quality
Learning Objectives
After completing this chapter you should be able to:
1. Construct and interpret visual data displays, including the stem-and-leaf plot, the histogram, and the box
plot
2. Compute and interpret the sample mean, the sample variance, the sample standard deviation, and the
sample range
3. Explain the concepts of a random variable and a probability distribution
4. Understand and interpret the mean, variance, and standard deviation of a probability distribution
5. Determine probabilities from probability distributions
6. Construct and interpret confidence intervals on a single mean and on the difference in two means
7. Construct and interpret confidence intervals on a single variance and the ratio of two variances
8. Construct and interpret confidence intervals on a single proportion and on the difference in two proportions
9. Understand how the analysis of variance (ANOVA) is used to compare more than two samples
Important Terms and Concepts
Alternative hypothesis
Analysis of variance (ANOVA)
Approximations to probability
distributions
Binomial distribution
Box plot
Central limit theorem
Checking assumptions for
statistical
inference procedures
Chi-square distribution
Confidence interval
Confidence intervals on means,
known variance(s)
Confidence intervals on means,
unknown variance(s)
Confidence intervals on
proportions
Confidence intervals on the
variance of a normal distribution
Confidence intervals on the
variances
of two normal distributions
Continuous distribution
Control limit theorem
Critical region for a test statistic
Descriptive statistics
Discrete distribution
Exponential distribution
F-distribution
Histogram
Hypothesis testing
Interquartile range
Mean of a distribution
Median
Negative binomial
distribution
Normal distribution
Normal probability plot
Parameters of a distribution
Percentile
Poisson distribution
Population
Power of a statistical test
Probability distribution
Probability plotting
P-value
Quartile
Random sample
Random variable
Residual analysis
Run chart
Sampling distribution
Standard deviation
Standard normal distribution
Statistic
Statistics
Stem-and-leaf display
t-distribution
Test statistic
Tests of hypotheses on means,
known variance(s)
Tests of hypotheses on means,
unknown variance(s)
Tests of hypotheses on
proportions
Tests of hypotheses on the
variance
of a normal distribution
Tests of hypotheses on the
variances
of two normal distributions
Time series plot
Type I error
Type II error
Uniform distribution
Variance of a distribution
Loading page 8...
Exercises
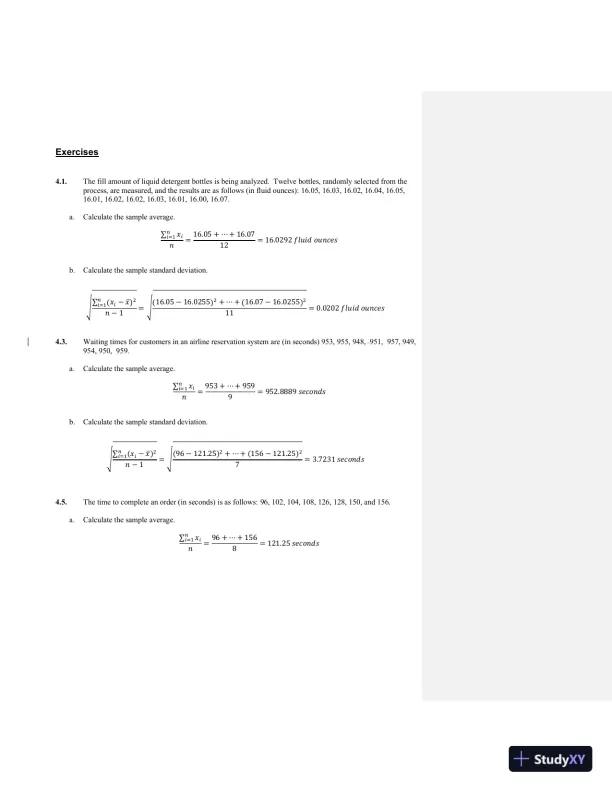
4.1. The fill amount of liquid detergent bottles is being analyzed. Twelve bottles, randomly selected from the
process, are measured, and the results are as follows (in fluid ounces): 16.05, 16.03, 16.02, 16.04, 16.05,
16.01, 16.02, 16.02, 16.03, 16.01, 16.00, 16.07.
a. Calculate the sample average.
∑ 𝑥𝑖
𝑛
𝑖=1
𝑛 = 16.05 + ⋯ + 16.07
12 = 16.0292 𝑓𝑙𝑢𝑖𝑑 𝑜𝑢𝑛𝑐𝑒𝑠
b. Calculate the sample standard deviation.
√∑ (𝑥𝑖 − 𝑥̅ )2𝑛
𝑖=1
𝑛 − 1 = √(16.05 − 16.0255)2 + ⋯ + (16.07 − 16.0255)2
11 = 0.0202 𝑓𝑙𝑢𝑖𝑑 𝑜𝑢𝑛𝑐𝑒𝑠
4.3. Waiting times for customers in an airline reservation system are (in seconds) 953, 955, 948, 951, 957, 949,
954, 950, 959.
a. Calculate the sample average.
∑ 𝑥𝑖
𝑛
𝑖=1
𝑛 = 953 + ⋯ + 959
9 = 952.8889 𝑠𝑒𝑐𝑜𝑛𝑑𝑠
b. Calculate the sample standard deviation.
√∑ (𝑥𝑖 − 𝑥̅ )2𝑛
𝑖=1
𝑛 − 1 = √(96 − 121.25)2 + ⋯ + (156 − 121.25)2
7 = 3.7231 𝑠𝑒𝑐𝑜𝑛𝑑𝑠
4.5. The time to complete an order (in seconds) is as follows: 96, 102, 104, 108, 126, 128, 150, and 156.
a. Calculate the sample average.
∑ 𝑥𝑖
𝑛
𝑖=1
𝑛 = 96 + ⋯ + 156
8 = 121.25 𝑠𝑒𝑐𝑜𝑛𝑑𝑠
Loading page 9...
b. Calculate the sample standard deviation.
√∑ (𝑥𝑖 − 𝑥̅ )2𝑛
𝑖=1
𝑛 − 1 = √(96 − 121.25)2 + ⋯ + (156 − 121.25)2
7 = 22.6258 𝑠𝑒𝑐𝑜𝑛𝑑𝑠
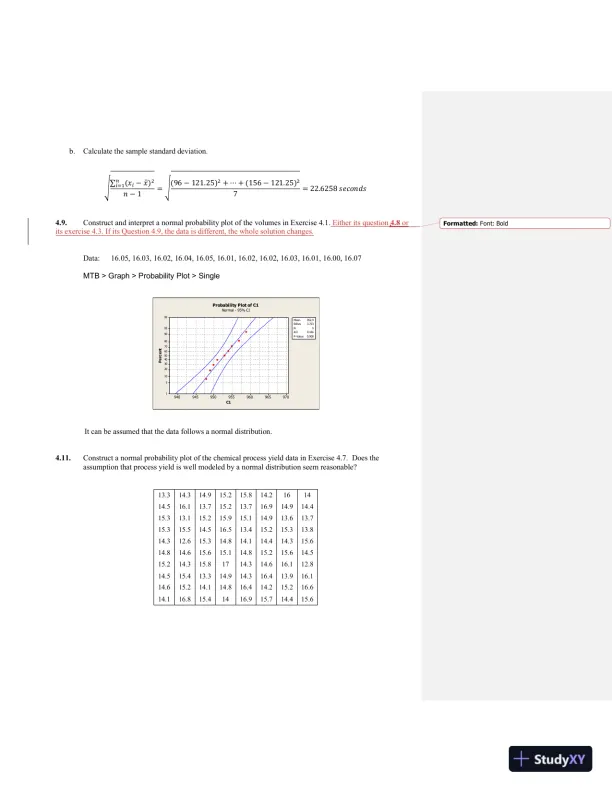
4.9. Construct and interpret a normal probability plot of the volumes in Exercise 4.1. Either its question 4.8 or
its exercise 4.3. If its Question 4.9, the data is different, the whole solution changes.
Data: 16.05, 16.03, 16.02, 16.04, 16.05, 16.01, 16.02, 16.02, 16.03, 16.01, 16.00, 16.07
MTB > Graph > Probability Plot > Single
It can be assumed that the data follows a normal distribution.
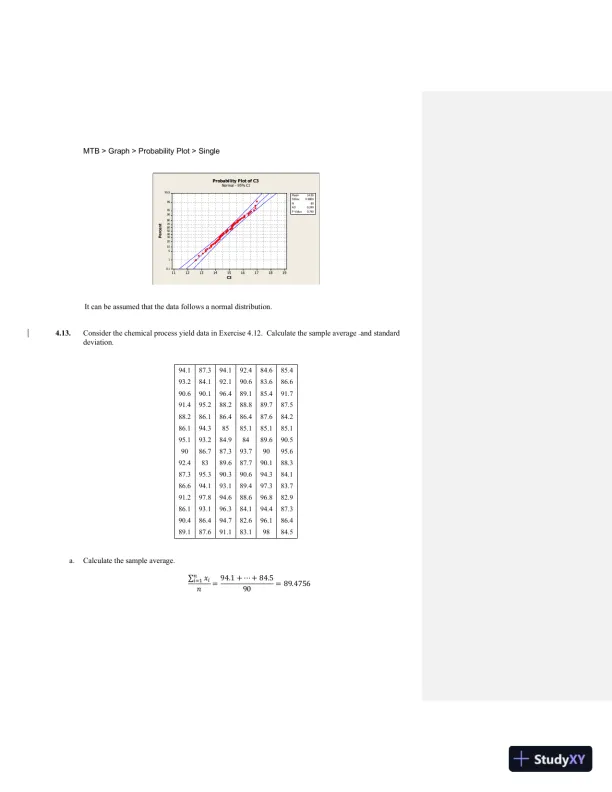
4.11. Construct a normal probability plot of the chemical process yield data in Exercise 4.7. Does the
assumption that process yield is well modeled by a normal distribution seem reasonable?
13.3 14.3 14.9 15.2 15.8 14.2 16 14
14.5 16.1 13.7 15.2 13.7 16.9 14.9 14.4
15.3 13.1 15.2 15.9 15.1 14.9 13.6 13.7
15.3 15.5 14.5 16.5 13.4 15.2 15.3 13.8
14.3 12.6 15.3 14.8 14.1 14.4 14.3 15.6
14.8 14.6 15.6 15.1 14.8 15.2 15.6 14.5
15.2 14.3 15.8 17 14.3 14.6 16.1 12.8
14.5 15.4 13.3 14.9 14.3 16.4 13.9 16.1
14.6 15.2 14.1 14.8 16.4 14.2 15.2 16.6
14.1 16.8 15.4 14 16.9 15.7 14.4 15.6970965960955950945940
99
95
90
80
70
60
50
40
30
20
10
5
1
C1
Percent
Mean 952.9
StDev 3.723
N 9
AD 0.166
P-Value 0.908
Probability Plot of C1
Normal - 95% CI
Formatted: Font: Bold
Loading page 10...
MTB > Graph > Probability Plot > Single
It can be assumed that the data follows a normal distribution.
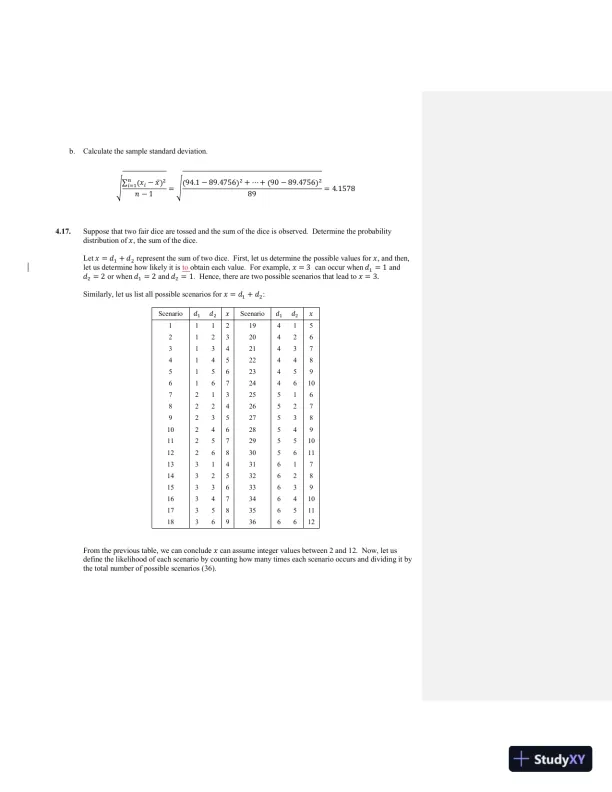
4.13. Consider the chemical process yield data in Exercise 4.12. Calculate the sample average and standard
deviation.
94.1 87.3 94.1 92.4 84.6 85.4
93.2 84.1 92.1 90.6 83.6 86.6
90.6 90.1 96.4 89.1 85.4 91.7
91.4 95.2 88.2 88.8 89.7 87.5
88.2 86.1 86.4 86.4 87.6 84.2
86.1 94.3 85 85.1 85.1 85.1
95.1 93.2 84.9 84 89.6 90.5
90 86.7 87.3 93.7 90 95.6
92.4 83 89.6 87.7 90.1 88.3
87.3 95.3 90.3 90.6 94.3 84.1
86.6 94.1 93.1 89.4 97.3 83.7
91.2 97.8 94.6 88.6 96.8 82.9
86.1 93.1 96.3 84.1 94.4 87.3
90.4 86.4 94.7 82.6 96.1 86.4
89.1 87.6 91.1 83.1 98 84.5
a. Calculate the sample average.
∑ 𝑥𝑖
𝑛
𝑖=1
𝑛 = 94.1 + ⋯ + 84.5
90 = 89.4756191817161514131211
99.9
99
95
90
80
70
60
50
40
30
20
10
5
1
0.1
C3
Percent
Mean 14.90
StDev 0.9804
N 80
AD 0.249
P-Value 0.740
Probability Plot of C3
Normal - 95% CI
Loading page 11...
b. Calculate the sample standard deviation.
√∑ (𝑥𝑖 − 𝑥̅ )2𝑛
𝑖=1
𝑛 − 1 = √(94.1 − 89.4756)2 + ⋯ + (90 − 89.4756)2
89 = 4.1578
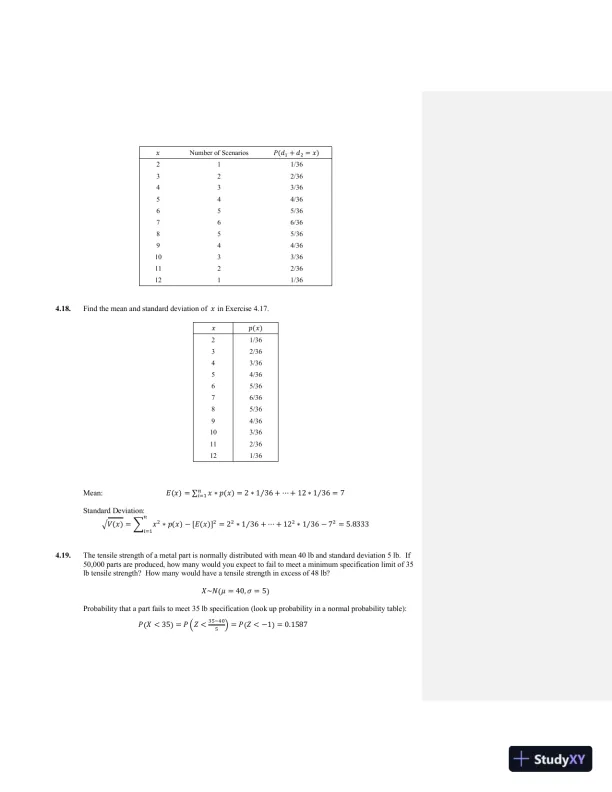
4.17. Suppose that two fair dice are tossed and the sum of the dice is observed. Determine the probability
distribution of 𝑥, the sum of the dice.
Let 𝑥 = 𝑑1 + 𝑑2 represent the sum of two dice. First, let us determine the possible values for 𝑥, and then,
let us determine how likely it is to obtain each value. For example, 𝑥 = 3 can occur when 𝑑1 = 1 and
𝑑2 = 2 or when 𝑑1 = 2 and 𝑑2 = 1. Hence, there are two possible scenarios that lead to 𝑥 = 3.
Similarly, let us list all possible scenarios for 𝑥 = 𝑑1 + 𝑑2:
Scenario 𝑑1 𝑑2 𝑥 Scenario 𝑑1 𝑑2 𝑥
1 1 1 2 19 4 1 5
2 1 2 3 20 4 2 6
3 1 3 4 21 4 3 7
4 1 4 5 22 4 4 8
5 1 5 6 23 4 5 9
6 1 6 7 24 4 6 10
7 2 1 3 25 5 1 6
8 2 2 4 26 5 2 7
9 2 3 5 27 5 3 8
10 2 4 6 28 5 4 9
11 2 5 7 29 5 5 10
12 2 6 8 30 5 6 11
13 3 1 4 31 6 1 7
14 3 2 5 32 6 2 8
15 3 3 6 33 6 3 9
16 3 4 7 34 6 4 10
17 3 5 8 35 6 5 11
18 3 6 9 36 6 6 12
From the previous table, we can conclude 𝑥 can assume integer values between 2 and 12. Now, let us
define the likelihood of each scenario by counting how many times each scenario occurs and dividing it by
the total number of possible scenarios (36).
Loading page 12...
𝑥 Number of Scenarios 𝑃(𝑑1 + 𝑑2 = 𝑥)
2 1 1/36
3 2 2/36
4 3 3/36
5 4 4/36
6 5 5/36
7 6 6/36
8 5 5/36
9 4 4/36
10 3 3/36
11 2 2/36
12 1 1/36
4.18. Find the mean and standard deviation of 𝑥 in Exercise 4.17.
𝑥 𝑝(𝑥)
2 1/36
3 2/36
4 3/36
5 4/36
6 5/36
7 6/36
8 5/36
9 4/36
10 3/36
11 2/36
12 1/36
Mean: 𝐸(𝑥) = ∑ 𝑥 ∗ 𝑝(𝑥) = 2 ∗ 1 36 + ⋯ + 12 ∗ 1 36⁄⁄ = 7𝑛
𝑖=1
Standard Deviation:
√𝑉(𝑥) = ∑ 𝑥2 ∗ 𝑝(𝑥) − [𝐸(𝑥)]2 = 22 ∗ 1 36 + ⋯ + 122 ∗ 1 36⁄⁄ − 72 = 5.8333
𝑛
𝑖=1
4.19. The tensile strength of a metal part is normally distributed with mean 40 lb and standard deviation 5 lb. If
50,000 parts are produced, how many would you expect to fail to meet a minimum specification limit of 35
lb tensile strength? How many would have a tensile strength in excess of 48 lb?
𝑋~𝑁(𝜇 = 40, 𝜎 = 5)
Probability that a part fails to meet 35 lb specification (look up probability in a normal probability table):
𝑃(𝑋 < 35) = 𝑃 (𝑍 < 35−40
5 ) = 𝑃(𝑍 < −1) = 0.1587
Loading page 13...
Expected number of parts that fail to meet 35 lb:
𝑛𝑃(𝑋 < 35) = 50,000 ∗ 0.1587 ≈ 7,9337935 𝑝𝑎𝑟𝑡𝑠
4.23. A light bulb has a normally distributed light output with mean 5,000 end foot-candles and standard
deviation of 50 end foot-candles. Find a lower specification limit such that only 0.5% of the bulbs will not
exceed this limit.
𝑋~𝑁(𝜇 = 5000, 𝜎 = 50)
Lower specification limit (x): 𝑃(𝑋 < 𝑥) = 𝑃 (𝑍 < 𝑥−5000
50 ) = 𝑃(𝑍 < 𝑧) = 0.005
Look up inverse value of 𝑧 in probability table: 𝑧 = 𝑥−5000
50 = −2.5758
𝑥 = 5000 + 50𝑧 = 5000 − 2.5758 ∗ 50 = 4,871.2085
4.25. The tensile strength of fiber used in manufacturing cloth is of interest to the purchaser. Previous
experience indicates that the standard deviation of tensile strength is 2 psi. A random sample of eight fiber
specimens is selected, and the average tensile strength is found to be 127 psi.
a. Build a 95% lower confidence interval in the mean tensile strength.
𝜇 ≥ 𝑥̅ − 𝑧0.05 ∗ 𝜎 √𝑛⁄ = 127 − 1.6449 ∗ 2 √8 = 125.8369⁄ psi
b. What can you conclude?
For 95% of the timeCIs constructed, the mean tensile strength is expected to be equal to or exceed
125.8369 psi.
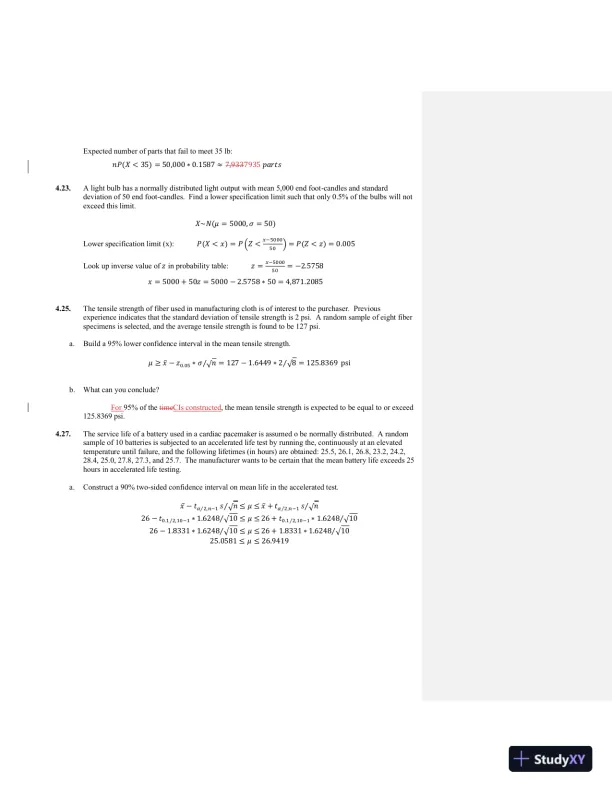
4.27. The service life of a battery used in a cardiac pacemaker is assumed o be normally distributed. A random
sample of 10 batteries is subjected to an accelerated life test by running the, continuously at an elevated
temperature until failure, and the following lifetimes (in hours) are obtained: 25.5, 26.1, 26.8, 23.2, 24.2,
28.4, 25.0, 27.8, 27.3, and 25.7. The manufacturer wants to be certain that the mean battery life exceeds 25
hours in accelerated life testing.
a. Construct a 90% two-sided confidence interval on mean life in the accelerated test.
𝑥̅ − 𝑡𝛼 2,𝑛−1⁄ 𝑠 √𝑛 ≤ 𝜇 ≤⁄ 𝑥̅ + 𝑡𝛼 2,𝑛−1⁄ 𝑠 √𝑛⁄
26 − 𝑡0.1 2,10−1⁄ ∗ 1.6248 √10 ≤ 𝜇 ≤⁄ 26 + 𝑡0.1 2,10−1⁄ ∗ 1.6248 √10⁄
26 − 1.8331 ∗ 1.6248 √10 ≤ 𝜇 ≤⁄ 26 + 1.8331 ∗ 1.6248 √10⁄
25.0581 ≤ 𝜇 ≤ 26.9419
Loading page 14...
b. Construct a normal probability plot of the battery life data. What conclusions can you draw?
MTB > Graph > Probability Plot > Single
Normality assumption is reasonable. Also, the manufacturer can be certain that the mean exceeds 25 hours,
95% of the CIs constructed will not contain a mean of 25 hrs.time, given the lower limit for the confidence
interval exceeds 25 hrs.
NOTE: Conclusions on the confidence interval are highly dependent on the number of significant digits used
throughout the calculations.
4.29. A company has just purchased a new billboard near the freeway. Sales for the past 10 days have been 483,
532, 444, 510, 467, 461, 450, 444, 540, and 499. Build a 95% two-sided confidence interval on sales. Is
there any evidence that the billboard has increased sales from its previous average of 475 per day?
𝑥̅ − 𝑡𝛼 2,𝑛−1⁄ 𝑠 √𝑛 ≤ 𝜇 ≤⁄ 𝑥̅ + 𝑡𝛼 2,𝑛−1⁄ 𝑠 √𝑛⁄
483 − 𝑡0.05 2,10−1⁄ ∗ 35.7553 √10 ≤ 𝜇 ≤⁄ 483 + 𝑡0.05 2,10−1⁄ ∗ 35.7553 √10⁄
483 − 2.2622 ∗ 35.7553 √10 ≤ 𝜇 ≤⁄ 483 + 2.2622 ∗ 35.7553 √10⁄
457.4217 ≤ 𝜇 ≤ 508.5783
Since 475 is within the confidence interval, there is no evidence that the billboard has increased sales from
its previous average of 475 per day.
NOTE: Confidence intervals endpoints are highly dependent on the number of significant digits used throughout the
calculations.
4.31. A company is evaluating the quality of aluminum rods received in a recent shipment. Diameters of
aluminum alloy rods produced on an extrusion machine are known to have a standard deviation of 0.0001
in. A random sample of 25 rods has an average diameter of 0.5046 in. Test whether or not the mean rod
diameter is 0.5025 using a two-sided confidence interval.
𝑥̅ − 𝑧0.05 2⁄ ∗ 𝜎 √𝑛⁄ ≤ 𝜇 ≤ 𝑥̅ + 𝑧0.05 2⁄ ∗ 𝜎 √𝑛⁄
0.5046 − 1.96 ∗ 0.0001 √25⁄ ≤ 𝜇 ≤ 0.5046 − 1.96 ∗ 0.0001 √25⁄
0.504561 ≤ 𝜇 ≤ 0.50463932302826242220
99
95
90
80
70
60
50
40
30
20
10
5
1
C1
Percent
Mean 26
StDev 1.625
N 10
AD 0.114
P-Value 0.986
Probability Plot of C1
Normal - 95% CI
Loading page 15...
Since 0.5025 is not within the confidence interval, we do not have evidence to state the mean rod diameter
is 0.5025 in.
4.33. Last month, a large national bank’s average payment time was 33 days with a standard deviation of 4 days.
This month, the average payment time was 33.5 days with a standard deviation of 4 days. They had 1,000
customers both months.
a. Build a 95% confidence interval on the difference between this month’s and last month’s payment times.
Is there evidence that payment times are increasing?
Using a one-sided confidence interval:
𝜇𝐶𝑢𝑟𝑟𝑒𝑛𝑡 − 𝜇𝑃𝑟𝑒𝑣𝑖𝑜𝑢𝑠 ≥ 𝑥̅𝐶𝑢𝑟𝑟𝑒𝑛𝑡 − 𝑥̅𝑃𝑟𝑒𝑣𝑖𝑜𝑢𝑠 − 𝜎0.05√𝜎𝐶𝑢𝑟𝑟𝑒𝑛𝑡
2
𝑛𝐶𝑢𝑟𝑟𝑒𝑛𝑡
+ 𝜎𝑃𝑟𝑒𝑣𝑖𝑜𝑢𝑠
2
𝑛𝑃𝑟𝑒𝑣𝑖𝑜𝑢𝑠
𝜇𝐶𝑢𝑟𝑟𝑒𝑛𝑡 − 𝜇𝑃𝑟𝑒𝑣𝑖𝑜𝑢𝑠 ≥ 33.5 − 33 − 1.6449√ 42
1000 + 42
1000 = 0.2058
Since the lower limit for the difference is positive, there is evidence to state that the payment times are
increasing.
Using a two-sided confidence interval :
𝑥̅𝐶𝑢𝑟𝑟𝑒𝑛𝑡 − 𝑥̅𝑃𝑟𝑒𝑣𝑖𝑜𝑢𝑠 − 𝜎0.05 2⁄ √𝜎𝐶𝑢𝑟𝑟𝑒𝑛𝑡
2
𝑛𝐶𝑢𝑟𝑟𝑒𝑛𝑡
+ 𝜎𝑃𝑟𝑒𝑣𝑖𝑜𝑢𝑠
2
𝑛𝑃𝑟𝑒𝑣𝑖𝑜𝑢𝑠
≤ 𝜇𝐶𝑢𝑟𝑟𝑒𝑛𝑡 − 𝜇𝑃𝑟𝑒𝑣𝑖𝑜𝑢𝑠
≤ 𝑥̅ 𝐶𝑢𝑟𝑟𝑒𝑛𝑡 + 𝑥̅𝑃𝑟𝑒𝑣𝑖𝑜𝑢𝑠 + 𝜎0.05 2⁄ √𝜎𝐶𝑢𝑟𝑟𝑒𝑛𝑡
2
𝑛𝐶𝑢𝑟𝑟𝑒𝑛𝑡
+ 𝜎𝑃𝑟𝑒𝑣𝑖𝑜𝑢𝑠
2
𝑛𝑃𝑟𝑒𝑣𝑖𝑜𝑢𝑠
33.5 − 33 − 1.96√ 42
1000 + 42
1000 ≤ 𝜇𝐶𝑢𝑟𝑟𝑒𝑛𝑡 − 𝜇𝑃𝑟𝑒𝑣𝑖𝑜𝑢𝑠 ≤ 33.5 − 33 + 1.96√ 42
1000 + 42
1000
0.149 ≤ 𝜇𝐶𝑢𝑟𝑟𝑒𝑛𝑡 − 𝜇𝑃𝑟𝑒𝑣𝑖𝑜𝑢𝑠 ≤ 0.851
We still arrive at the same conclusion that payment times have increased given the entire confidence
interval is greater than zero.
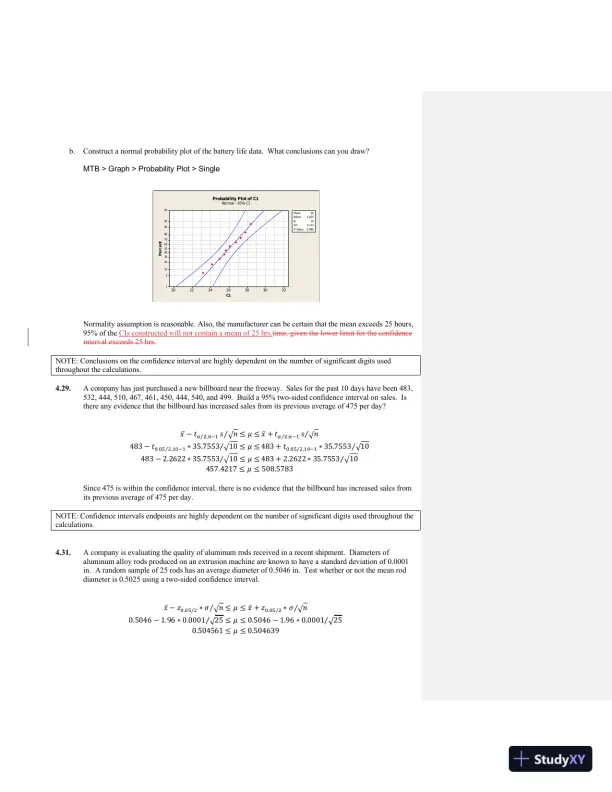
4.35. A supplier received results on the hardness of metal from two different hardening process (1) salt-water
quenching and (2) oil quenching. The results are shown in Table 4E.4.
Loading page 16...
Salt Quench Oil Quench
145 152
150 150
153 147
148 155
141 140
152 146
146 158
154 152
139 151
148 143
a. Construct a 95% confidence interval on the difference in mean hardness.
Using a two-sided confidence interval assuming unequal variances:
=
(𝑠1
2
𝑛1 + 𝑠2
2
𝑛2)
2
(𝑠1
2
𝑛1)
2
𝑛1 − 1 +
(𝑠2
2
𝑛2)
2
𝑛2 − 1
= (24.7111
10 + 29.8222
10 )
2
(24.7111
10 )
2
10 − 1 + (29.8222
10 )
2
10 − 1
= 17.3992 ⇒ 17
𝑥̅𝑆𝑄 − 𝑥̅ 𝑂𝑄 − 𝑡0.05 2,
⁄ √𝑠𝑆𝑄
2
𝑛𝑆𝑄
+ 𝑠𝑂𝑄
2
𝑛𝑂𝑄
≤ 𝜇𝑆𝑄 − 𝜇𝑂𝑄 ≤ 𝑥̅𝑆𝑄 − 𝑥̅𝑂𝑄 + 𝑡0.05 2,
⁄ √𝑠𝑆𝑄
2
𝑛𝑆𝑄
+ 𝑠𝑂𝑄
2
𝑛𝑂𝑄
147.6 − 149.4 − 2.1098√24.7111
10 + 29.8222
10 ≤ 𝜇𝑆𝑄 − 𝜇𝑂𝑄 ≤ 33.5 − 33 + 2.1098√24.7111
10 + 29.8222
10
−6.7269 ≤ 𝜇𝑆𝑄 − 𝜇𝑂𝑄 ≤ 3.1269
b. Construct a 95% confidence interval on the ratio of variances.
𝑠1
2
𝑠2
2 𝐹1−𝛼 2,𝑛2−1,𝑛1−1⁄ ≤ 𝜎𝑆𝑄
2 𝜎𝑂𝑄
2
⁄ ≤ 𝑠1
2
𝑠2
2 𝐹𝛼 2,𝑛2−1,𝑛1−1⁄
24.7111
29.8222 𝐹1−0.05 2,10−1,10−1⁄ ≤ 𝜎𝑆𝑄
2 𝜎𝑂𝑄
2
⁄ ≤ 24.7111
29.8222 𝐹0.05 2,10−1,10−1⁄
24.7111
29.8222 ∗ 0.2484 ≤ 𝜎𝑆𝑄
2 𝜎𝑂𝑄
2
⁄ ≤ 24.7111
29.8222 ∗ 4.0260
0.2058 ≤ 𝜎𝑆𝑄
2 𝜎𝑂𝑄
2
⁄ ≤ 3.3360
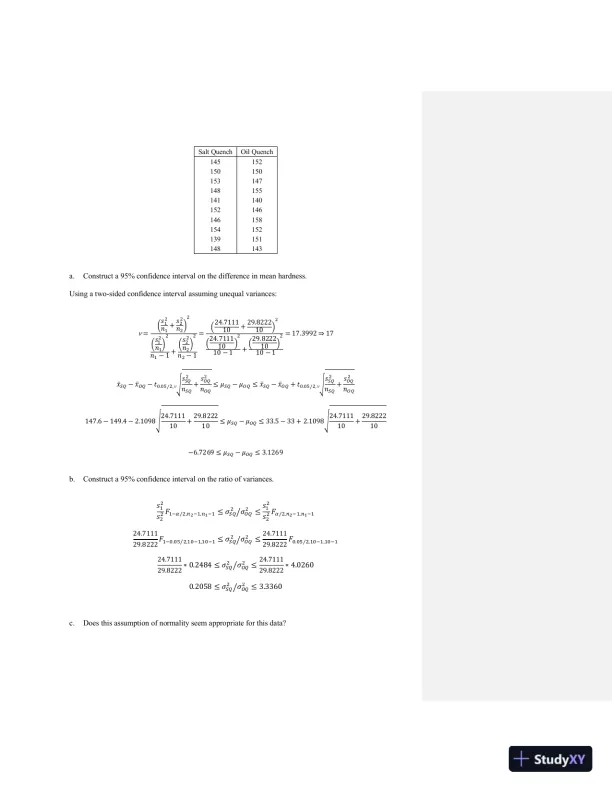
c. Does this assumption of normality seem appropriate for this data?
Loading page 17...
MTB > Graph > Probability Plot > Single
The normality assumption for both samples looks reasonable.
d. What can you conclude?
For the confidence interval based on the mean difference, zero is included within the interval. For the
confidence interval based on the ratio of the variances, one is included within the interval. Hence, there is no
significance significant difference in the sample means or variances.
4.37. A random sample of 500 connecting rod pins contains 65 nonconforming units. Estimate the process
fraction nonconforming. Construct a 90% upper confidence interval on the true process fraction
nonconforming. Is it possible that the true fraction nonconforming defective is 10%?
Process fraction nonconforming estimate: 𝑝̂ = 65
500 = 0.13
90% upper confidence interval: 𝑝 ≤ 𝑝̅ + 𝑧0.1√𝑝̅(1−𝑝̅ )
𝑛
𝑝 ≤ 0.13 + 1.2816√0.13∗(1−0.13)
500
𝑝 ≤ 0.1493
For 90% of the timeCIs constructed, the true defective fraction is less than 14.93% (evidence suggests p
might be larger than 0.10)
4.41. A new purification unit is installed in a chemical process. Before and after installation data was collected
regarding the percentage of impurity:
Before (1): Sample mean = 9.85, Sample variance = 6.79, Number of samples = 10
After (2): Sample mean = 8.08, Sample variance = 6.18, Number of samples = 8170160150140130
99
95
90
80
70
60
50
40
30
20
10
5
1
170160150140130
Salt Quench
Percent
Oil Quench
Mean 147.6
StDev 4.971
N 10
AD 0.218
P-Value 0.779
Salt Quench
Mean 149.4
StDev 5.461
N 10
AD 0.169
P-Value 0.906
Oil Quench
Probability Plot of Salt Quench, Oil Quench
Normal - 95% CI
Loading page 18...
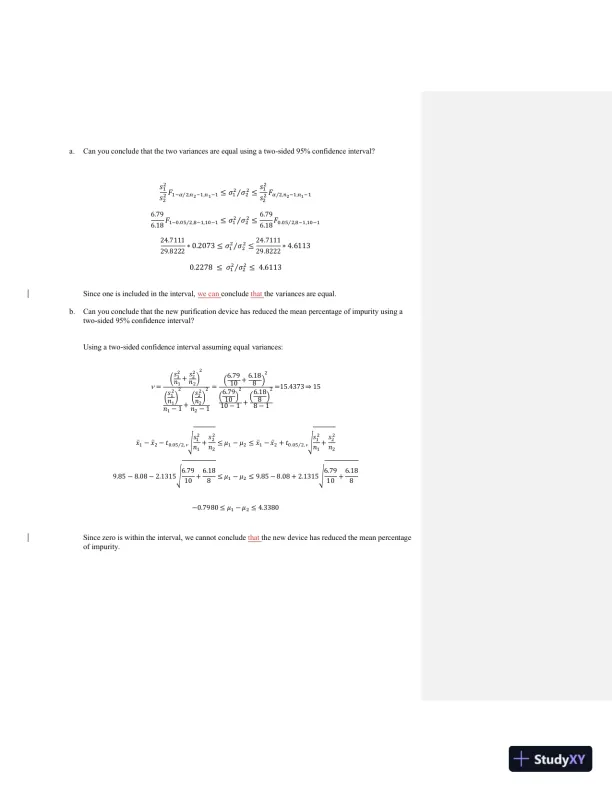
a. Can you conclude that the two variances are equal using a two-sided 95% confidence interval?
𝑠1
2
𝑠2
2 𝐹1−𝛼 2,𝑛2−1,𝑛1−1⁄ ≤ 𝜎1
2 𝜎2
2
⁄ ≤ 𝑠1
2
𝑠2
2 𝐹𝛼 2,𝑛2−1,𝑛1−1⁄
6.79
6.18 𝐹1−0.05 2,8−1,10−1⁄ ≤ 𝜎1
2 𝜎2
2
⁄ ≤ 6.79
6.18 𝐹0.05 2,8−1,10−1⁄
24.7111
29.8222 ∗ 0.2073 ≤ 𝜎1
2 𝜎2
2
⁄ ≤ 24.7111
29.8222 ∗ 4.6113
0.2278 ≤ 𝜎1
2 𝜎2
2
⁄ ≤ 4.6113
Since one is included in the interval, we can conclude that the variances are equal.
b. Can you conclude that the new purification device has reduced the mean percentage of impurity using a
two-sided 95% confidence interval?
Using a two-sided confidence interval assuming equal variances:
=
(𝑠1
2
𝑛1 + 𝑠2
2
𝑛2)
2
(𝑠1
2
𝑛1)
2
𝑛1 − 1 +
(𝑠2
2
𝑛2)
2
𝑛2 − 1
= (6.79
10 + 6.18
8 )
2
(6.79
10 )
2
10 − 1 + (6.18
8 )
2
8 − 1
=15.4373 ⇒ 15
𝑥̅1 − 𝑥̅2 − 𝑡0.05 2,
⁄ √𝑠1
2
𝑛1
+ 𝑠2
2
𝑛2
≤ 𝜇1 − 𝜇2 ≤ 𝑥̅1 − 𝑥̅2 + 𝑡0.05 2,
⁄ √𝑠1
2
𝑛1
+ 𝑠2
2
𝑛2
9.85 − 8.08 − 2.1315√6.79
10 + 6.18
8 ≤ 𝜇1 − 𝜇2 ≤ 9.85 − 8.08 + 2.1315√6.79
10 + 6.18
8
−0.7980 ≤ 𝜇1 − 𝜇2 ≤ 4.3380
Since zero is within the interval, we cannot conclude that the new device has reduced the mean percentage
of impurity.
Loading page 19...
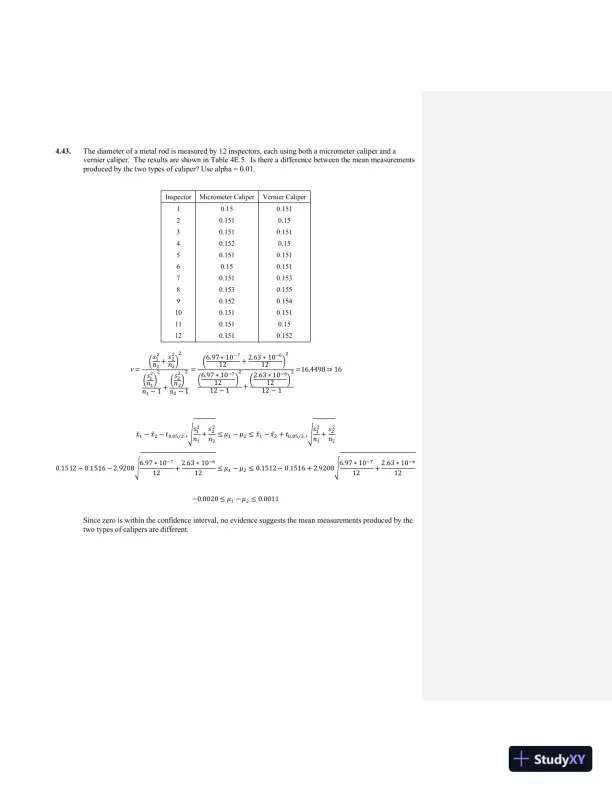
4.43. The diameter of a metal rod is measured by 12 inspectors, each using both a micrometer caliper and a
vernier caliper. The results are shown in Table 4E.5. Is there a difference between the mean measurements
produced by the two types of caliper? Use alpha = 0.01.
Inspector Micrometer Caliper Vernier Caliper
1 0.15 0.151
2 0.151 0.15
3 0.151 0.151
4 0.152 0.15
5 0.151 0.151
6 0.15 0.151
7 0.151 0.153
8 0.153 0.155
9 0.152 0.154
10 0.151 0.151
11 0.151 0.15
12 0.151 0.152
=
(𝑠1
2
𝑛1 + 𝑠2
2
𝑛2)
2
(𝑠1
2
𝑛1)
2
𝑛1 − 1 +
(𝑠2
2
𝑛2)
2
𝑛2 − 1
=
(6.97 ∗ 10−7
12 + 2.63 ∗ 10−6
12 )
2
(6.97 ∗ 10−7
12 )
2
12 − 1 + (2.63 ∗ 10−6
12 )
2
12 − 1
=16.4498 ⇒ 16
𝑥̅1 − 𝑥̅2 − 𝑡0.05 2,
⁄ √𝑠1
2
𝑛1
+ 𝑠2
2
𝑛2
≤ 𝜇1 − 𝜇2 ≤ 𝑥̅1 − 𝑥̅2 + 𝑡0.05 2,
⁄ √𝑠1
2
𝑛1
+ 𝑠2
2
𝑛2
0.1512 − 0.1516 − 2.9208√6.97 ∗ 10−7
12 + 2.63 ∗ 10−6
12 ≤ 𝜇1 − 𝜇2 ≤ 0.1512 − 0.1516 + 2.9208√6.97 ∗ 10−7
12 + 2.63 ∗ 10−6
12
−0.0020 ≤ 𝜇1 − 𝜇2 ≤ 0.0011
Since zero is within the confidence interval, no evidence suggests the mean measurements produced by the
two types of calipers are different.
Loading page 20...
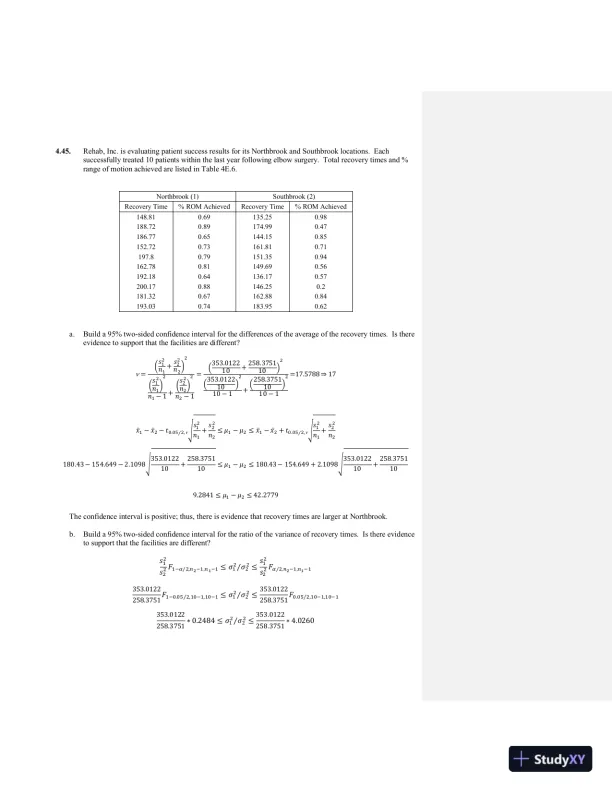
4.45. Rehab, Inc. is evaluating patient success results for its Northbrook and Southbrook locations. Each
successfully treated 10 patients within the last year following elbow surgery. Total recovery times and %
range of motion achieved are listed in Table 4E.6.
Northbrook (1) Southbrook (2)
Recovery Time % ROM Achieved Recovery Time % ROM Achieved
148.81 0.69 135.25 0.98
188.72 0.89 174.99 0.47
186.77 0.65 144.15 0.85
152.72 0.73 161.81 0.71
197.8 0.79 151.35 0.94
162.78 0.81 149.69 0.56
192.18 0.64 136.17 0.57
200.17 0.88 146.25 0.2
181.32 0.67 162.88 0.84
193.03 0.74 183.95 0.62
a. Build a 95% two-sided confidence interval for the differences of the average of the recovery times. Is there
evidence to support that the facilities are different?
=
(𝑠1
2
𝑛1 + 𝑠2
2
𝑛2)
2
(𝑠1
2
𝑛1)
2
𝑛1 − 1 +
(𝑠2
2
𝑛2)
2
𝑛2 − 1
= (353.0122
10 + 258.3751
10 )
2
(353.0122
10 )
2
10 − 1 + (258.3751
10 )
2
10 − 1
=17.5788 ⇒ 17
𝑥̅1 − 𝑥̅2 − 𝑡0.05 2,
⁄ √𝑠1
2
𝑛1
+ 𝑠2
2
𝑛2
≤ 𝜇1 − 𝜇2 ≤ 𝑥̅1 − 𝑥̅2 + 𝑡0.05 2,
⁄ √𝑠1
2
𝑛1
+ 𝑠2
2
𝑛2
180.43 − 154.649 − 2.1098√353.0122
10 + 258.3751
10 ≤ 𝜇1 − 𝜇2 ≤ 180.43 − 154.649 + 2.1098√353.0122
10 + 258.3751
10
9.2841 ≤ 𝜇1 − 𝜇2 ≤ 42.2779
The confidence interval is positive; thus, there is evidence that recovery times are larger at Northbrook.
b. Build a 95% two-sided confidence interval for the ratio of the variance of recovery times. Is there evidence
to support that the facilities are different?
𝑠1
2
𝑠2
2 𝐹1−𝛼 2,𝑛2−1,𝑛1−1⁄ ≤ 𝜎1
2 𝜎2
2
⁄ ≤ 𝑠1
2
𝑠2
2 𝐹𝛼 2,𝑛2−1,𝑛1−1⁄
353.0122
258.3751 𝐹1−0.05 2,10−1,10−1⁄ ≤ 𝜎1
2 𝜎2
2
⁄ ≤ 353.0122
258.3751 𝐹0.05 2,10−1,10−1⁄
353.0122
258.3751 ∗ 0.2484 ≤ 𝜎1
2 𝜎2
2
⁄ ≤ 353.0122
258.3751 ∗ 4.0260
Loading page 21...
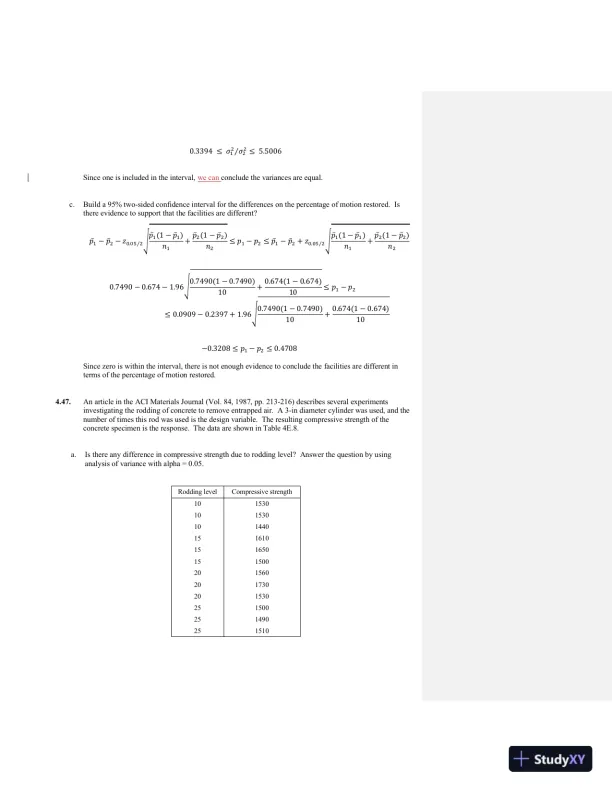
0.3394 ≤ 𝜎1
2 𝜎2
2
⁄ ≤ 5.5006
Since one is included in the interval, we can conclude the variances are equal.
c. Build a 95% two-sided confidence interval for the differences on the percentage of motion restored. Is
there evidence to support that the facilities are different?
𝑝̅1 − 𝑝̅2 − 𝑧0.05 2⁄ √𝑝̅1(1 − 𝑝̅1)
𝑛1
+ 𝑝̅2(1 − 𝑝̅2)
𝑛2
≤ 𝑝1 − 𝑝2 ≤ 𝑝̅1 − 𝑝̅2 + 𝑧0.05 2⁄ √𝑝̅1(1 − 𝑝̅1)
𝑛1
+ 𝑝̅2(1 − 𝑝̅2)
𝑛2
0.7490 − 0.674 − 1.96√0.7490(1 − 0.7490)
10 + 0.674(1 − 0.674)
10 ≤ 𝑝1 − 𝑝2
≤ 0.0909 − 0.2397 + 1.96√0.7490(1 − 0.7490)
10 + 0.674(1 − 0.674)
10
−0.3208 ≤ 𝑝1 − 𝑝2 ≤ 0.4708
Since zero is within the interval, there is not enough evidence to conclude the facilities are different in
terms of the percentage of motion restored.
4.47. An article in the ACI Materials Journal (Vol. 84, 1987, pp. 213-216) describes several experiments
investigating the rodding of concrete to remove entrapped air. A 3-in diameter cylinder was used, and the
number of times this rod was used is the design variable. The resulting compressive strength of the
concrete specimen is the response. The data are shown in Table 4E.8.
a. Is there any difference in compressive strength due to rodding level? Answer the question by using
analysis of variance with alpha = 0.05.
Rodding level Compressive strength
10 1530
10 1530
10 1440
15 1610
15 1650
15 1500
20 1560
20 1730
20 1530
25 1500
25 1490
25 1510
Loading page 22...
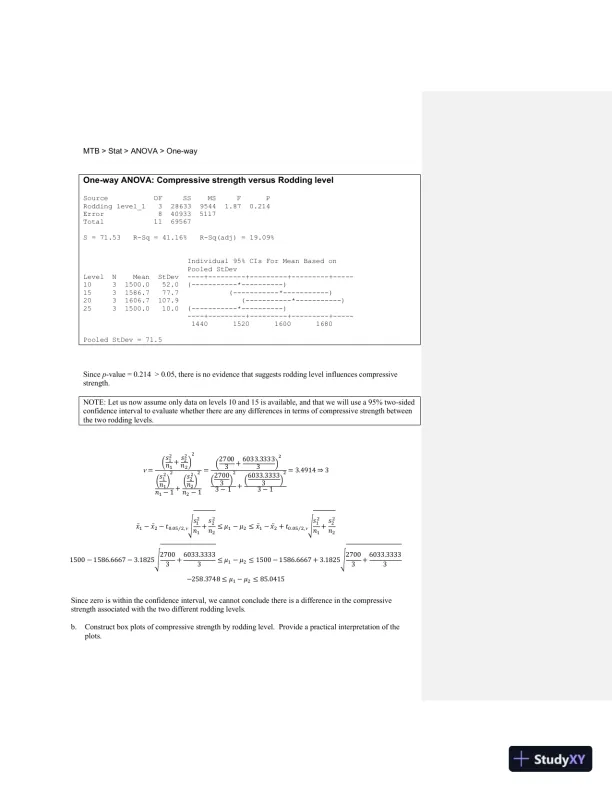
MTB > Stat > ANOVA > One-way
One-way ANOVA: Compressive strength versus Rodding level
Source DF SS MS F P
Rodding level_1 3 28633 9544 1.87 0.214
Error 8 40933 5117
Total 11 69567
S = 71.53 R-Sq = 41.16% R-Sq(adj) = 19.09%
Individual 95% CIs For Mean Based on
Pooled StDev
Level N Mean StDev ----+---------+---------+---------+-----
10 3 1500.0 52.0 (-----------*----------)
15 3 1586.7 77.7 (-----------*-----------)
20 3 1606.7 107.9 (-----------*-----------)
25 3 1500.0 10.0 (-----------*----------)
----+---------+---------+---------+-----
1440 1520 1600 1680
Pooled StDev = 71.5
Since p-value = 0.214 > 0.05, there is no evidence that suggests rodding level influences compressive
strength.
NOTE: Let us now assume only data on levels 10 and 15 is available, and that we will use a 95% two-sided
confidence interval to evaluate whether there are any differences in terms of compressive strength between
the two rodding levels. =
(𝑠1
2
𝑛1 + 𝑠2
2
𝑛2)
2
(𝑠1
2
𝑛1)
2
𝑛1 − 1 +
(𝑠2
2
𝑛2)
2
𝑛2 − 1
= (2700
3 + 6033.3333
3 )
2
(2700
3 )
2
3 − 1 + (6033.3333
3 )
2
3 − 1
= 3.4914 ⇒ 3
𝑥̅1 − 𝑥̅2 − 𝑡0.05 2,
⁄ √𝑠1
2
𝑛1
+ 𝑠2
2
𝑛2
≤ 𝜇1 − 𝜇2 ≤ 𝑥̅1 − 𝑥̅2 + 𝑡0.05 2,
⁄ √𝑠1
2
𝑛1
+ 𝑠2
2
𝑛2
1500 − 1586.6667 − 3.1825√2700
3 + 6033.3333
3 ≤ 𝜇1 − 𝜇2 ≤ 1500 − 1586.6667 + 3.1825√2700
3 + 6033.3333
3
−258.3748 ≤ 𝜇1 − 𝜇2 ≤ 85.0415
Since zero is within the confidence interval, we cannot conclude there is a difference in the compressive
strength associated with the two different rodding levels.
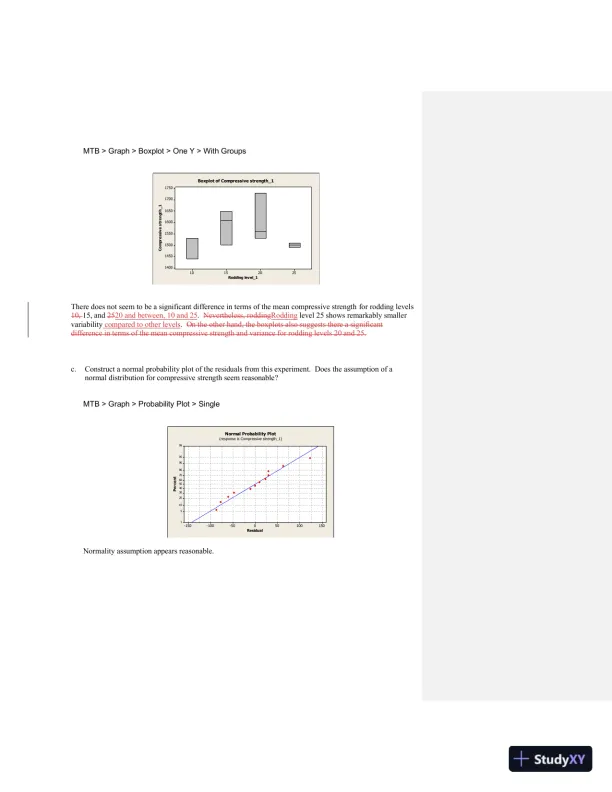
b. Construct box plots of compressive strength by rodding level. Provide a practical interpretation of the
plots.
Loading page 23...
MTB > Graph > Boxplot > One Y > With Groups
There does not seem to be a significant difference in terms of the mean compressive strength for rodding levels
10, 15, and 2520 and between, 10 and 25. Nevertheless, roddingRodding level 25 shows remarkably smaller
variability compared to other levels. On the other hand, the boxplots also suggests there a significant
difference in terms of the mean compressive strength and variance for rodding levels 20 and 25.
c. Construct a normal probability plot of the residuals from this experiment. Does the assumption of a
normal distribution for compressive strength seem reasonable?
MTB > Graph > Probability Plot > Single
Normality assumption appears reasonable.25201510
1750
1700
1650
1600
1550
1500
1450
1400
Rodding level_1
Compressive strength_1
Boxplot of Compressive strength_1150100500-50-100-150
99
95
90
80
70
60
50
40
30
20
10
5
1
Residual
Percent
Normal Probability Plot
(response is Compressive strength_1)
Loading page 24...
CHAPTER 5
Control Charts for Variables
Learning Objectives
After completing this chapter you should be able to:
1. Understand chance and assignable causes of variability in a process
2. Explain the statistical basis of the Shewhart control chart, including choice of sample size, control limits,
and sampling interval
3. Explain the rational subgroup concept
4. Explain how sensitizing rules and pattern recognition are used in conjunction with control charts
5. Know how to design variables control charts
6. Know how to set up and use and R control charts
7. Know how to set up and use and S control charts
8. Know how to set up and use control charts for individual measurements
9. Understand the importance of the normality assumption for individuals control charts and know how to
check this assumption
10. Set up and use CUSUM control charts for monitoring the process mean
11. Set up and use EWMA control charts for monitoring the process mean
12. Understand the difference between process capability and process potential
13. Calculate and properly interpret process capability ratios
14. Understand the role of the normal distribution in interpreting most process capability ratios
Important Terms and Concepts
Assignable causes of variation
Control chart
Control limits
CUSUM control chart
EWMA control chart
In-control process
Individuals control chart
One-sided process-capability
ratios
Out-of-control process
Out-of-control-action plan
(OCAP)
Pareto chart
PCR Cp
PCR Cpk
PCR Cpm
Process capability
R control chart
Rational subgroups
s control chart
Sampling frequency for control
charts
Shewhart control charts
Signal resistance of a control chart
Specification limits
Statistical control of a process
Statistical process control (SPC)
Three-sigma control limits
Variable sample size on control
charts
Variables control charts
x control chart
Loading page 25...
Exercises
5.14. Consider the control chart shown here. Does the pattern appear random?
No. The last four runs appear to plot at a distance of one-sigma or beyond from the center line.
5.15. Consider the control chart shown here. Does the pattern appear random?
Yes, the pattern appears random.
5.16. Consider the control chart shown here. Does the pattern appear random?
Yes, the pattern appears random.
Loading page 26...
5.17. Apply the Western Electric rules to the control chart in Exercise 5.17. Are any of the criteria for declaring
the process out of control satisfied?
Check:
1. Any point outside the 3-sigma control limits? NO.
2. 2 of 3 beyond 2 sigma of centerline? NO.
3. 4 of 5 at 1 sigma or beyond of centerline? YES. Points 17, 18, 19, and 20 are outside the lower 1-
sigma area.
4. 8 consecutive points on one side of centerline? NO.
The process can be declared out-of-control because the last four runs appear to plot at a distance of one-
sigma or beyond from the center line.
Loading page 27...
5.19. Consider the time-varying process behavior shown below. Match each of these several patterns of
process performance to the corresponding and R charts shown in Figures (a) to (e) below.
Loading page 28...
Behavior Control Chart
(a) (2)
(b) (4)
(c) (5)
(d) (1)
(e) (3)
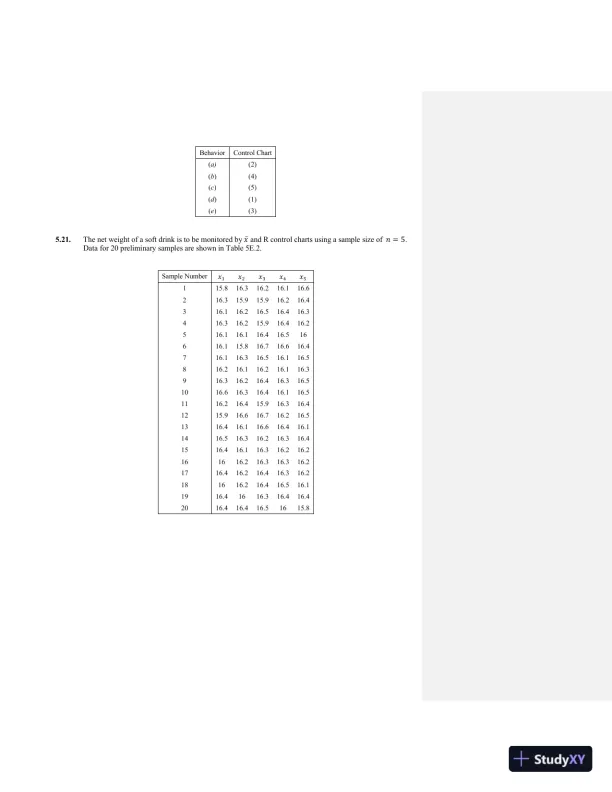
5.21. The net weight of a soft drink is to be monitored by 𝑥̅ and R control charts using a sample size of 𝑛 = 5.
Data for 20 preliminary samples are shown in Table 5E.2.
Sample Number 𝑥1 𝑥2 𝑥3 𝑥4 𝑥5
1 15.8 16.3 16.2 16.1 16.6
2 16.3 15.9 15.9 16.2 16.4
3 16.1 16.2 16.5 16.4 16.3
4 16.3 16.2 15.9 16.4 16.2
5 16.1 16.1 16.4 16.5 16
6 16.1 15.8 16.7 16.6 16.4
7 16.1 16.3 16.5 16.1 16.5
8 16.2 16.1 16.2 16.1 16.3
9 16.3 16.2 16.4 16.3 16.5
10 16.6 16.3 16.4 16.1 16.5
11 16.2 16.4 15.9 16.3 16.4
12 15.9 16.6 16.7 16.2 16.5
13 16.4 16.1 16.6 16.4 16.1
14 16.5 16.3 16.2 16.3 16.4
15 16.4 16.1 16.3 16.2 16.2
16 16 16.2 16.3 16.3 16.2
17 16.4 16.2 16.4 16.3 16.2
18 16 16.2 16.4 16.5 16.1
19 16.4 16 16.3 16.4 16.4
20 16.4 16.4 16.5 16 15.8
Loading page 29...
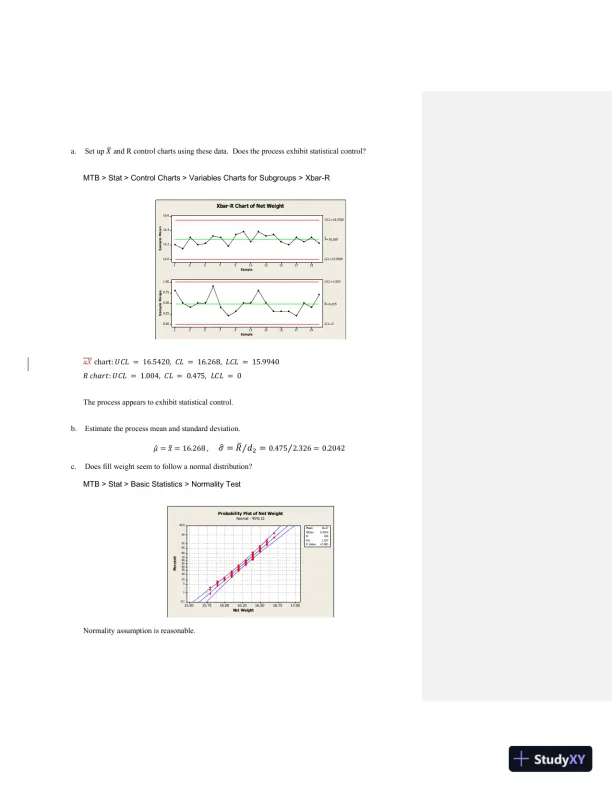
a. Set up 𝑋̅ and R control charts using these data. Does the process exhibit statistical control?
MTB > Stat > Control Charts > Variables Charts for Subgroups > Xbar-R
𝑥𝑋̅̅̅̅ chart: 𝑈𝐶𝐿 = 16.5420, 𝐶𝐿 = 16.268, 𝐿𝐶𝐿 = 15.9940
𝑅 𝑐ℎ𝑎𝑟𝑡: 𝑈𝐶𝐿 = 1.004, 𝐶𝐿 = 0.475, 𝐿𝐶𝐿 = 0
The process appears to exhibit statistical control.
b. Estimate the process mean and standard deviation.
𝜇̂ = 𝑥̿ = 16.268 , 𝜎̂ = 𝑅̅ 𝑑2⁄ = 0.475 2.326⁄ = 0.2042
c. Does fill weight seem to follow a normal distribution?
MTB > Stat > Basic Statistics > Normality Test
Normality assumption is reasonable.191715131197531
16.6
16.4
16.2
16.0
Sample
Sample M ean
__
X=16.268
U C L=16.5420
LC L=15.9940
191715131197531
1.00
0.75
0.50
0.25
0.00
Sample
Sample Range
_
R=0.475
U C L=1.004
LC L=0
Xbar-R Chart of Net Weight17.0016.7516.5016.2516.0015.7515.50
99.9
99
95
90
80
70
60
50
40
30
20
10
5
1
0.1
Net Weight
Percent
Mean 16.27
StDev 0.2014
N 100
AD 1.257
P-Value <0.005
Probability Plot of Net Weight
Normal - 95% CI
Loading page 30...
Loading page 31...
30 more pages available. Scroll down to load them.
Preview Mode
Sign in to access the full document!
100%
Study Now!
XY-Copilot AI
Unlimited Access
Secure Payment
Instant Access
24/7 Support
AI Assistant
Document Details
Subject
Business Management