Solution Manual For Matching Supply with Demand: An Introduction to Operations Management, 4th Edition

Solution Manual For Matching Supply with Demand: An Introduction to Operations Management, 4th Edition gives you the answers you need, explained in a simple and clear way.

Chloe Martinez
Contributor
4.3
36
9 months ago
Preview (23 of 76 Pages)
100%
Purchase to unlock

Page 1

Solution Manual For Matching Supply with Demand: An Introduction to Operations Management, 4th Edition - Page 1 preview image

Loading page image...

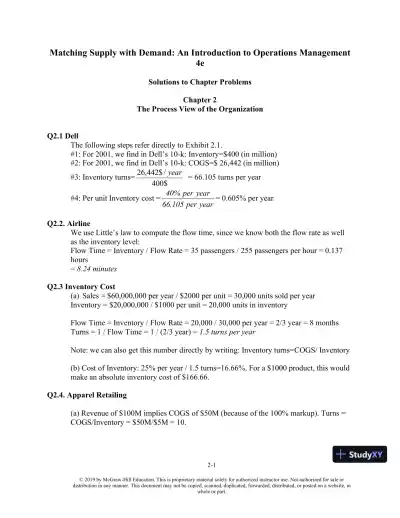
2-1Matching Supply with Demand: An Introduction to Operations Management4eSolutions to Chapter ProblemsChapter 2The Process View of the OrganizationQ2.1 DellThe following steps refer directly to Exhibit 2.1.#1: For 2001, we find in Dell’s 10-k: Inventory=$400 (in million)#2: For 2001, we find in Dell’s 10-k: COGS=$ 26,442 (in million)#3: Inventory turns=$400/$442,26year= 66.105 turns per year#4: Per unit Inventory cost =yearper66.105yearper40%= 0.605% per yearQ2.2.AirlineWe use Little’s law to compute the flow time, since we know both the flow rate as wellas the inventory level:Flow Time = Inventory / Flow Rate = 35 passengers / 255 passengers per hour = 0.137hours=8.24 minutesQ2.3Inventory Cost(a)Sales = $60,000,000 per year / $2000 per unit = 30,000 units sold per yearInventory = $20,000,000 / $1000 per unit = 20,000 units in inventoryFlow Time = Inventory / Flow Rate = 20,000 / 30,000 per year = 2/3 year = 8 monthsTurns = 1 / Flow Time = 1 / (2/3 year) =1.5 turns per yearNote: we can also get this number directly by writing: Inventory turns=COGS/ Inventory(b)Cost of Inventory: 25% per year / 1.5 turns=16.66%. For a $1000 product, this wouldmake an absolute inventory cost of $166.66.Q2.4.Apparel Retailing(a)Revenue of $100M implies COGS of $50M (because of the 100% markup). Turns =COGS/Inventory = $50M/$5M = 10.

Page 2

Solution Manual For Matching Supply with Demand: An Introduction to Operations Management, 4th Edition - Page 2 preview image

Loading page image...

Page 3

Solution Manual For Matching Supply with Demand: An Introduction to Operations Management, 4th Edition - Page 3 preview image

Loading page image...

2-2(b)The inventory cost, given 10 turns, is 40%/10 = 4%. For a 30$ item, the inventorycost is0.4 x $30 =$1.20 per unit.Q2.5.La Villa(a)Flow Rate = Inventory / Flow Time = 1200 skiers / 10 days =120 skiers per day(b)Last year: on any given day, 10% (1 of 10) of skiers are on their first day of skiingThis year: on any given day, 20% (1 of 5) of skiers are on their first day of skiingAverage amount spent in local restaurants (per skier)Last year = 0.1 * $50 + 0.9 * $30 = $32This year = 0.2 * $50 + 0.8 * $30 = $34% change = ($34-$32) / $32 =6.25% increaseQ2.6.HighwayWe look at 1 mile of highway as our process. Since the speed is 60 miles per hour, ittakes a car 1 minute to travel through the process (flow time).There are 24 cars on ¼ of a mile, i.e. there are 96 cars on the 1 mile stretch (inventory).Inventory=Flow Rate * Flow Time: 96 cars=Flow Rate * 1 minuteThus, the Flow Rate is 96 cars per minute, corresponding to 96*60=5760 cars per hour.Q2.7.Strohrmann BakingThe bread needs to be in the oven for 12 minutes (flow time). We want to produce at aflow rate of 4000 breads per hour, or 4000/60=66.66 breads per minute.Inventory=Flow Rate * Flow Time: Inventory=66.66 breads per minute* 12 minutesThus, Inventory=800 breads, which is the required size of the oven.Q2.8.Mt Kinley ConsultingWe have the following information available from the question:LevelInventory (number ofconsultants at that level)Flow Time (time spent at thatlevel)Associate2004 yearsManager606 yearsPartner2010 years(a) We can use Little’s law to find the flow rate for associate consultants:Inventory=Flow Rate * Flow Time; 200 consultants=Flow Rate * 4 years; thus, the flowrate is 50 consultants per year, which need to be recruited to keep the firm in its currentsize (note: while there are also 50 consultants leaving the associate level, this says

Page 4

Solution Manual For Matching Supply with Demand: An Introduction to Operations Management, 4th Edition - Page 4 preview image

Loading page image...

2-3nothing about how many of them are dismissed vs how many of them are promoted toManager level).(b) We can perform a similar analysis at the manager level, which indicates that the flowrate there is 10 consultants. In order to have 10 consultants as a flow rate at the managerlevel, we need to promote 10 associates to manager level (remember, the firm is notrecruiting to the higher ranks from the outside). Hence, every year, we dismiss 40associates and promote 10 associates to the manager level (the odds at that level are 20%)Now, consider the partner level. The flow rate there is 2 consultants per year (obtainedvia the same calculations as before). Thus, from the 10 manager cases we evaluate everyyear, 8 are dismissed and 2 are promoted to partner (the odds at that level are thereby also20%).In order to find the odds of a new hire to become partner, we need to multiply thepromotion probabilities: 0.2*0.2=0.04. Thus, a new hire has a 4% chance of making it topartner.Q2.9. Major US Retailersa.Product stays on average for 31.9 days in Costco’s inventoryb.Costco has for a $5 product an inventory cost of $0.1311 which compares to a$0.2049 at Wal-MartQ2.10. McDonald’sa.Inventory turns for McDonald’s were 92.3. They were 30.05 for Wendy’s.b.McDonald’s has per unit inventory costs of0.32%, which for a 3$ meal about$0.00975. That compares to 0.998% at Wendy’s where the cost per meal is $0.0299.Q2.11.BCHI = 400 associates, T = 2years. R = I / T = 400 associates / 2 yrs = 200 associates/yr.Q2.12.KrogerTurns = R / I = 76858 / 6244= 12.3

Page 5

Solution Manual For Matching Supply with Demand: An Introduction to Operations Management, 4th Edition - Page 5 preview image

Loading page image...

Last revised May 20183-1Matching Supply with Demand: An Introduction to Operations Management4eSolutions to Chapter ProblemsChapter 3Understanding the Supply Process: Evaluating Process CapacityQ3.1 Process Analysis with One Flow Unit(a)Capacity of the three resources in units per hour are 60 * 2 / 10 = 12, 60 *1 / 6 = 10; 60 *3 / 16 = 11.25. The bottleneck is the resource with the lowest capacity, which is resource2.(b)The process capacity is the capacity of the bottleneck, which is 10 units/hr.(c)If demand = 8 units/hr, then the process is demand constrained and the flow rate is 8units/hr(d)Utilization = Flow Rate / Capacity. For the three resources they are 8 / 12, 8 / 10, and 8 /11.25.Q3.2Process Analysis withMultiple Flow Unitsa)Bottleneck is resource 3 because it has the highest implied utilization of 125%. Thedemands per hour of the three products are 40/8 = 5, 50/8 = 6.25 and 60/8 = 7.5. The totalminutes of work demanded per hour at resource 1 is 5 x 5 + 6.25 * 5 + 7.5 * 5 =93.75.Two workers at resource 1 produce 2 * 60 = 120 min of work per hour. So resource 1’sutilization is 93.75 / 120 = 0.78. Utilization at the other resources are similarly evaluated.b)The capacity of resource 3 is 60 / 15 = 4 units per hour. Given the ratio of units producedmust be 4 to 5 to 6, the process can produce 4 units/ hr of A, 5 units/hr of B and 6 units/hrof C.Q3.3.CranberryCranberries arrive at a rate of 150 barrels per hour. They get processed at a rate of 100 barrelsper hour. Thus, inventory accumulates at a rate of 150-100=50 barrels per hour. This happenswhile trucks arrive, i.e. from 6am to 2pm. The highest inventory level thereby is 8h*50 barrelsper hour=400 barrels. From these 400 barrels, 200 barrels are in the bins, the other 200 barrelsare in trucks.(a) 200 barrels(b) From 2pm onwards, no additional cranberries are received. Inventory gets depleted at a rateof 100 barrels per hour. Thus, it will take 2h until the inventory level has dropped to 200 barrels,at which time all waiting cranberries can be stored in the bins (no more truck waiting)(c) It will take another 2 hours until all the bins are empty(d) Since the seasonal workers only start at 10:00am, the first 4 hours of the day we accumulate4hours * 50barrels per hour=200 barrels. For the remaining time that we receive incoming

Page 6

Solution Manual For Matching Supply with Demand: An Introduction to Operations Management, 4th Edition - Page 6 preview image

Loading page image...

Last revised May 20183-2cranberries, our processing rate is higher (125 barrels per hour). Thus, inventory onlyaccumulates at a rate of 25 (150-125 barrels per hour). Given that this happens over 4 hours, weget another 100 barrels in inventory. At 2pm, we thereby have 300 barrels in inventory. After2pm, we receive no further cranberries, yet we initially process cranberries at a rate of 125barrels per hour. Thus, it only takes 100 barrels / 125 barrels/hour=0.8 hours=48 minutes until allbinsare empty.From then, we need another 2h until the bins are empty.Q3.4.Western Pennsylvania MilkWe start the day with 25,000 gallons of milk in inventory. From 8am onwards, we produce 5,000gallons, yet we ship 10,000 gallons. Thus inventory is depleted at a rate of 5000 gallons per hour,which leaves us without milk after 5 hours (at 1pm). From then onwards, clients will have towait. This situation gets worse and worse and by 6pm (last client arrives), we are short 25,000gallons.(a) 1pm(b) Clients will stop waiting when we have worked off our 25,000 gallon backlog that we arefacing at 6pm. Since we are doing this at a rate of 5,000 gallon per hour, clients will stop waitingat 11pm (after 5 more hours).(c) At 6pm, we have a backlog of 25,000 gallons, which is equivalent to 20 trucks(d) The waiting time is the area in the triangle-width: beginning of waiting (1pm) to end of waiting (11pm)=10 hours-height: maximum number of trucks waiting: 20 (see part c above)Hence, we can compute the area in the triangle as: 0.5*10hours*20trucks=100 truck* hoursThe cost for this waiting is 50$/truck* hour * 100 truck hours=5000$Q3.5.Bagel Store(a) The bottleneck is “Veggies on Bagel”, as it has the highest implied utilization.ResourceAvailableminutesper hourGrilledveggiebagelVeggiebagelCreamcheesebagelTotalImpliedutilizationCut603*33*113*45454/60Grilledstuff603*10003030/60Veggies onBagel603*511*507070/60Creamcheese60004*41616/60Wrap603*211*24*23636/60(b) If we want to keep the product mix constant (i.e. keep the ration between the various bageltypes at 3:11:4), we need to scale down demand by 60/70. This leads to the following flow rates:-Grilled veggie: 3*60/70 bagels / hour

Page 7

Solution Manual For Matching Supply with Demand: An Introduction to Operations Management, 4th Edition - Page 7 preview image

Loading page image...

Last revised May 20183-3-Veggie: 11*60/70 bagels / hour-Cream cheese: 4*60/70 bagels / hourIf we try to fulfill as much demand as possible, we encounter a problem with Veggie bagels andGrilled+Veggie bagels. Given that we have an implied utilization of 70/60% at the bottleneck,we can only fulfill 60/70% of demand for these two bagel types. We can meet all of demand forthe cream cheese bagels.Q3.6.Valley Forge Income TaxRecall that the demand for the 4 groups is:1: 15%2: 5%3: 50%4:30%There are three resources, the admin, the junior person, and the senior person. We compute theminutes of capacity they have available every month as well as their work-load, given that thereare 50 incoming returns to be processed. This leads to the following computations.ResourceMinutesper month1234Totalwork-loadImpliedutilizationAdmin96000.15*50*(20+50)0.05*50*(40+80)0.5*50*(20+30)0.3*50*(40+60)35750.372Senior96000.15*50*(30+20)0.05*50*(90+60)0.5*50*(0+5)0.3*50*(0+30)13250.138Junior96000.15*50*1200.05*50*3000.5*50*800.3*50*20066500.693(a) The junior person is the bottleneck, her implied utilization is the highest(b) Implied utilizations (see table)(c) One should consider: revenue, future revenue (lifetime value of customer), to what extent therequest draws on bottleneck capacity(d) not at all, since improvements at non-bottleneck steps don’t increase capacityQ3.7.Car Wash Supply Processa.The implied utilization at wheel cleaning is: 42 minutes of work from package 3 a day,84 minutes of work from package 4 per day, giving a total of 126 minutes per day.Relative to 720 minutes of available time, that gives an implied utilization of 17.5%.

Page 8

Solution Manual For Matching Supply with Demand: An Introduction to Operations Management, 4th Edition - Page 8 preview image

Loading page image...

Last revised May 20183-4b.The highest implied utilization is at step 1 (automated washing machine) where theimplied utilization is 55.55%.c.The new bottleneck will be the interior cleaning employeewith an implied utilization of111%d.Every day, we are 80 minutes of work short at step “interior cleaning”. That correspondsto four customers with package 4.Q3.8. Starbucksa.Time required of the frozen drink maker = 20*2 = 40 minutes. Each worker has 60minutes available, so the utilization for the frozen drink maker: 40/60b.Highest implied utilization is for the Espresso Drink Maker with 116.66%c.The workload on the cashier is as follows. 25 Drip coffee customer per hour at 1/3 minper customer = 25/3 min/hr. 5 Ground customers per hour at 1 min per customer = 5min/hr. 120 customers per hour at 1/3 min to pay per customer = 40 min/hr. 30% of 120customers per hour buying food, which is 36 customers per hour and they require 1/3 minper customer, for a total of 12 min/hr. In total the workload on the cashier is 25/3 + 5 +40 + 12 = 65.33 min/hr. The implied utilization is 65.33 / 60 = 108.9%. The impliedutilization of the other persons don’t change and they are66.66%and 116.66%.Q3.9. Paris Airporta.The implied utilization levels of the resources are computed as followsServersAvail. Min/HrRequestedImp. Util.Security424015062.50%Agents6360440122.22%Kiosk318016088.89%b.The backlog at the bottleneck accumulates at a rate of 80 “requested minutes” per hour.After 4 hours this is 4*80 = 320 “requested minutes” of work from the agents. This takes6 agents 320/360 = 8/9 = 0.89 hours to complete, or 53.4 minutes after the last arrivalc.When Kim arrives, the backlog is half as long as the final backlog in question 2, e.g.there are 160 “requested minutes” of work in front of Kim.This will take the agents160/360 = 0.45 hours =26.6 minutes to complete.Kim takes 3 minutes to completeservice with the agent and 30 seconds to pass through security (there is no line atsecurity) so the answer is 30 minutes and 10 secondsd.We compute the new utilizations as follows:ServersAvail. Min/HrRequestedImp. Util.Security424015062.50%Agents6360376104.44%Kiosk31803217.78%

Page 9

Solution Manual For Matching Supply with Demand: An Introduction to Operations Management, 4th Edition - Page 9 preview image

Loading page image...

Last revised May 20183-5Extra work accumulates at a rate of 16 minutes per hour for the agents, for a total of 64minutes after the last arrival.This takes the 6 agents 64/360 = 0.178 hours = 10.7minutes to complete, so 8:10 PM is the closest answer.

Page 10

Solution Manual For Matching Supply with Demand: An Introduction to Operations Management, 4th Edition - Page 10 preview image

Loading page image...

Last revised May 20184-1Matching Supply with Demand: An Introduction to Operations Management4eSolutions to Chapter ProblemsChapter 4Estimating and Reducing Labor CostsQ4.1.Empty System Labor Utilization(a) Time to complete 100 units:#1 The process will take 10+6+16minutes=32 minutes to produce the first unit.#2 We know from problem xyz that resource 2 is the bottleneck and the process capacity is0.1666 units per minute#3Time to finish 100 units=32 minutess/min0.1666unitunits99+=626 minutes(b) + (c) + (d) Use Exhibit for Labor computations#1 Capacities are:Resource 1: 2/10 units/ minute=0.2 units/minuteResource 2: 1/6 units/ minute=0.1666 units/minuteResource 3: 3/16 units/ minute=0.1875 units/minuteResource 2 is the bottleneck and the process capacity is 0.1666 units/minute#2 Since there is unlimited demand, the flow rate is determined by the capacity and thereby0.1666 units/minute; this corresponds to a cycle time of 6 minutes/unit#3 Cost of direct labor =s/h0.1666unit*6010$/h*6=6$/unit#4 Compute the idle time of each worker for each unit:Idle time for workers at resource 1=6min/unit*210 min/unit=2 min/unitIdle time for worker at resource 2=6min/unit*1-6min/unit = 0 min/unitIdle time for workers at resource 3=6min/unit*3-16min/unit=2 min/unit#5 Labor content=10+6+16 min/unit=32min/unit

Page 11

Solution Manual For Matching Supply with Demand: An Introduction to Operations Management, 4th Edition - Page 11 preview image

Loading page image...

Last revised May 20184-2#6 Average labor utilization=43232+=0.8888Q4.2.Assign tasks to workers(a)WorkerTask(s)ProcessingTime (sec)Capacity (units per hour)1130120222514433,4754845,64580The capacity of the current line isrestricted by the capacity of the step with the longestprocessingtime. Therefore, capacity = 1 / 75 sec =48 units per hour.(b)WorkerTask(s)ProcessingTime (sec)Capacity (units per hour)11,25565.452335102.8634409045,64580Therefore, capacity of the revised line = 1 / 55 sec =65.45 units per hour.(a)No matter how you organize the tasks, maximum capacity of the line is65.45 units per hour,i.e. at a cycle time of 55 seconds.Q4.3.Power Toys(a)Since every resource has exactly one worker assigned to it, the bottleneck is the assemblystation with the highestprocessingtime (#3)(b)Capacity = 1 / 90 sec= 40 units per hour(c)Direct labor cost = Labor cost per hour / flow rate= 9*15 $/h / 40 trucks per hour =3.38 $/truck(d)Direct labor cost in work cell= (75+85+90+65+70+55+80+65+80) sec/truck * $15/hr=2.77$/truck(e)Utilization = flow rate / capacity 85 sec / 90 sec =94.4%(f)WorkerStation(s)ProcessingTime (sec)Capacity (units per hour)117548228542.35

Page 12

Solution Manual For Matching Supply with Demand: An Introduction to Operations Management, 4th Edition - Page 12 preview image

Loading page image...

Last revised May 20184-333904044,513526.6756,713526.6768,914524.83(g)Capacity = 1 / 145 units/second =24.83 toy-trucks per hourQ4.4.12 tasks to 4 workers(a)WorkerTask(s)ProcessingTime (sec)Capacity (units per hour)11,2,37051.4324,5,65565.4537,8,98542.35410,11,126060(a)Capacity = 1 / 85 sec =42.35 units per hour(b)Direct labor content = (70+55+85+60) sec =270 sec/unit or 4.5 min/unit(c)Labor utilization = labor content / (labor content + total idle time)= 270 sec / (270 + 15 + 30+ 0 +25 sec) =79.41%(d)Note that we are facing a machine paced line, thus the first unit will take 4*85 seconds top gothrough the empty system. Flow Time = 4 * 85 sec + 99 / (1 / 85 sec) =8755 sec or 145.92 minor 2.43 hrs(e)There are multiple ways to achieve this capacity. This table shows only one example.WorkerTask(s)ProcessingTime (sec)Capacity (units per hour)11,25565.4523,4,55051.4336,77051.4348,935102.86510,11,126060Capacity = 1 / 70 units/sec =51.43 units per hour(f)There are multiple ways to achieve this capacity. This table shows only one example.WorkerTask(s)ProcessingTime (sec)Capacity (units per hour)11,25565.4523,4,65565.4535,8,105565.4547507259,11,125565.45Capacity = 1 / 55 units/sec =65.45 units per hour

Page 13

Solution Manual For Matching Supply with Demand: An Introduction to Operations Management, 4th Edition - Page 13 preview image

Loading page image...

Last revised May 20184-4(g)We have to achieve a cycle time of 3600/72=50 seconds/unit. The following task allocationincludes a lot of idle time, but is the only way to achieve the cycle time, given the constraints weface.WorkerTask(s)ProcessingTime (sec)113022,34034,5354620575068,940710,114081220Therefore, aminimum of 8 workersare required to achieve a capacity of 72 units per hour.Q4.5.Geneva Watch(a)Station Eis the bottleneck with a process capacity of 1 unit every 75 seconds.(b)Capacity = 1 / 75 sec =48 watches per hour(c)Direct labor content = 68 + 60 + 70 + 58 + 75 + 64 =395 sec(d)Utilization = 60 sec / 75 sec =80%(e)Idle time = (75-70) sec / 75 sec * 60 min per hour =4 min per hour; as an alternativecomputation, we can observe that the worker has 5 seconds idle time per cycle (i.e. per unit) andthat there are 48 cycles (units) per hour. Thus, the idle time over the course of an hour is 240seconds=4 minutes.(f)Time to produce 193 watches = time for the first watch + time for the remaining 192 watches= 6*75 seconds + 192*75 seconds=14,850 seconds=4h7min30sec. Production begins at 8:00, so193 watches will be completed by12:07:30Q4.6. Yoggo Soft Drinka.Bottling machine capacity: 1 bottles/secondLid machine capacity: 0.333 bottles/secTwo labeling machines capacity: 10/25=0.4 bottles/secPackaging machine capacity: 0.25 bottles/secSo the process capacity is going to be 0.25bottles/sec=0.25*3600=900 bottles/hourb. The packaging machine

Page 14

Solution Manual For Matching Supply with Demand: An Introduction to Operations Management, 4th Edition - Page 14 preview image

Loading page image...

Last revised May 20184-5c. It has no effect on the capacity since it is not the bottleneckd.Process capacity = 90 boxes/ hour, implied utilization=demand /capacity=0.666=66%Q4.7. Atlas Inca.The bottleneck is the worker with the highestprocessingtime (across activities),which is Worker 2 (60 seconds)b.Capacity of the line is decided by theprocessingtime of the bottleneck step.Hence we have Capacity = 1/ 60 sec = 60 units/hourc.Utilization is given by Flow Rate/ Capacity. Hence, we have Utilization = 45 sec/60 sec = 75%.d.Aswearefacinganemptysystem,thefirstunitwouldtake(50+60+30+45+40)=225 seconds to go through the system. Hence, Flow time =225 + (100-1)*60 = 102.75 minutese.Labor Utilization is given by Labor Content / ( Labor Content + Idle Time). TotalLabor Content can be calculated as (50+60+30+45+40)=225 seconds. Idle timefor each worker can be calculated as processing time ofbottleneck-processingtime of worker. Hence, we have Labor Utilization = 225/ (225+10+30+15+20) =75%.f.Direct Labor Cost = Labor Cost per Hour / Flow Rate = 5*$15/60 = $1.25/unitg.Again, there are multiple configurations that minimize completion time, but in allof these theprocessingtime of the bottleneck resource is 55 seconds. Hencemaximum achievable capacity is 1/ 55 sec = 65.5 units/hour.h.Direct Labor Cost = (30+20+35+25+30+45+40) sec * $15/hour = $0.9375/uniti.The bottleneck is worker 3, and process capacity is given by 1/ 75 sec = 48units/hourQ4.8. Glove Designa.Cutting has a process capacity of 1 glove/2 minutes*60 minutes = 30 gloves/hour.Dyeing has a process capacity of 1 glove/4 minutes*60 minutes = 15 gloves/hour.Stitching has a process capacity of 1 glove/3 minutes*60 minutes = 20 gloves/hour.Packaging has a process capacity of 1 glove/5 minutes*60 minutes = 12 gloves/hour.Therefore, the capacity isa. 12 gloves/hour.b. The first statement is incorrect because packaging is the bottleneck.The second statement isincorrect because in a machine-paced line or conveyor belt, the unit spends the same amount oftime at each station as the bottleneck. The fourth statement is incorrect because cutting is not thebottleneck.c. By reducing packaging time the process capacity increasesis correct becausepackaging is the bottleneck.

Page 15

Solution Manual For Matching Supply with Demand: An Introduction to Operations Management, 4th Edition - Page 15 preview image

Loading page image...

Last revised May 20184-6c. If the demand is 10 gloves/hour, then the implied utilization at packaging = 10/12 =d. 83.3%.d. A glove spends 5 minutes in each of 4 stations, so the flow time = 5*4 =c. 20 minutes.Q4.9. Worker Paceda. We know that Step 4 is the bottleneck and has a process capacity = to the capacity of the entireprocess because the utilization = 100%. We are given the fact that the process capacity = 36units/hour, and Step 5 has a utilization of 40%. Therefore, the capacity of Step 5 = 36/0.4 =d.90 units per hour.b. The step with the highest utilization is the bottleneck, ord. Step 4.c. The step with the highest utilization has the highest process capacity.Step 1 has a processcapacity of 36/(4/30) = 270 units/hour.Step 2 has a process capacity of 36/(4/15) = 135units/hour.Step 3 has a process capacity of 36/(4/5) = 45 units/hour. Step 4 has a processcapacity of 36 units/hour. Step 5 has a process capacity of 36/(2/5) = 90 units/hour. Therefore,the step with the highest capacity isa. Step 1.d. There are 5 workers per hour to make 36 units. The wages per hour, then = 5*$36 =$180 inlabor costs to make 36 units. Therefore, the direct cost of labor per unit = $180/36 =a. $5 perunit.

Page 16

Solution Manual For Matching Supply with Demand: An Introduction to Operations Management, 4th Edition - Page 16 preview image

Loading page image...

Last revised May 20185-1Matching Supply with Demand: An Introduction to Operations Management4eSolutions to Chapter ProblemsChapter5Batching and Other Flow Interruptions:Setup Times and the Economic Order Quantity ModelQ5.1 Window Boxesa)The production cycle consists of setup to produce part A (120 minutes), produce A (1minute per part), setup to produce B (120 minutes), and produce B (1 minute for twosides). The total setup time in this production cycle is 240 minutes. The processing timefor the two components is 2 minutes. There are 360 component sets produced in eachproduction cycle. So the capacity of the stamping machine is 360 / (240 + 2 x 360) =0.375 units per minute.b)We want to choose a batch size so that the capacity of the stamping process is the same asthe capacity of the assembly process. The capacity of the assembly process is (1/27 unitsper minute) x 12 workers = 12/27 units per minute. The desired batch size is found usingthe following equation: batch size = (flow rate x setup time) (1-flow rate x processingtime). Hence, batch size = (12/27 x 240)/(1-12/27 x 2) = 960.c)The batch size is 1260 part A. Because this batch is larger than 960 (from question 5.1b),the bottleneck is assembly. Hence, the flow rate of part A is 12/27 part units per minute(the capacity of assembly). The processing time of part A is 1 min. Average inventory =½ x 1260 units x (112/27 units per minute x 1 minute per part) = 350 part As.Q5.2Two-stepa)Capacity ofstep B is5 / (9 + 0.1 x 5) = 0.53unitsper minute. The first activity makes 1unitper minute, so the bottleneck is the second step.b)The flow rate is determined by the bottleneck, which is step A, and equals 1 unit perminute. The processing time at step B is 0.1 min per unit. The average inventory with abatch size of 15 is ½ x 15 x (1-1 unit per min x 0.1 min per unit) =6.75 units.c)The desired flow rate is 1 unit per minute because that is the capacity of step A.Recommended batch size = 1 x 9 / (1-1 x 0.1) = 10Q5.3Simple Set-Upa)First, we calculate the process capacity at each step using the formula for processcapacity with batching: B / S + Tbwhere B = batch size, S = set-up time, and Tb= timeto process the entire batch. So, the first step has a process capacity of 50 units / (20

Page 17

Solution Manual For Matching Supply with Demand: An Introduction to Operations Management, 4th Edition - Page 17 preview image

Loading page image...

Last revised May 20185-2minutes + (1*50) minutes) = .714 units/minute = 42.86 units/hour. The second step has aprocess capacity of 50 units / (2*50) minutes = 30 units/hour. The third step has aprocess capacity of 50 units / (1.5*50) minutes = 40 units/hour. Therefore, the processcapacity of the entire process= 30 units/hour.b)The only step that is dependent on the batch size is Step 1. With a batch size of 10units, the process capacity of the first step becomes 10 units / (20 minutes + (1*10)minutes) = 10 units / 30 minutes = 20 units/hour. Therefore, Step 1becomes thebottleneck.c)In order to determine an optimal batch size, we set the process capacity of Step 1 (theonly step dependent on batch size) equal to the process capacity of the bottleneckcapacity. The bottleneck capacity is 30 units/hour, or 1 unit every 2 minutes. So, wesolve for B using the following formula:1 unit / 2 minutes = B / (20 minutes + B minutes)B = 20 units.If B < 20 units, then Step 1 becomes the bottleneck and the capacity of theentire process decreases.d) Based on the answer to part (c), with a batch size of 40 the bottleneck is step 2 and theFlow rate is 30 units/hour. The processing time at step 1 is 1 min/unit, which converted tohours is 1/60 hour/unit. Average inventory after step 1 is therefore = ½ x 40 units x (1-30units/hour x 1/60 hour / unit) = 10 units.Q5.4Set-Up Everywherea)Capacity = B /(S +B x Processing Time) =35 parts / (30 minutes + (35 x0.25)minutes) = .903 units/minute =54.19 units/hourb)Step 2 is never the bottleneck because itsprocessingtime and setup time arealwaysless than Step 1’sprocessingtimeand setup time.So the task can be simplified todetermining for what values Steps 1 and 3 are the bottleneck. Theprocessingtime for thetwo steps are equal when 30+0.25B = 45+0.15B, or when B=150. For batches smallerthan 150 parts, Step 3 is the bottleneck. For batches larger than 150 parts, Step 1 is thebottleneck.Q5.5JCLa)Capacity of a step is given by Batch Size/ (Set-Up-Time + Batch xProcessingTime).Using this formula, the capacity of the three steps can be calculated as:Deposition: 100/ (45+0.15*100) = 1.67 units/min = 100 units/hourPatterning: 100/ (30+0.25*100) = 1.82 units/min = 109 units/hour

Page 18

Solution Manual For Matching Supply with Demand: An Introduction to Operations Management, 4th Edition - Page 18 preview image

Loading page image...

Last revised May 20185-3Etching: 100/ (20+0.2*100) = 2.5 units/min = 150 units/hourThe bottleneck is the “deposition” step and it determines process capacity.b)If batch size is B, thenprocessingtime of step 3 is 20 + 0.20B which is always lesser thanthe processing time ofstep 2, 30 + 0.25B, for a positive value of B. Hence step 3 cannever be the bottleneck.c)Under the new technology, the process capacity of step 1 is no longer dependent on batchsize and is (1/ 0.45 min/unit) = 2.22 units/min. This is clearly the maximum overallprocess capacity that can be targeted.Since the capacity of step 2 can never exceed the capacity of step 3 (since step 2’s runtime and setup time arebothhigher), we setthe batch size so the capacity of step 2matches 2.22 units/min. Thus, the target batch size = Target capacity x Setup time / (1(Target capacity x Processing time)) = 2.22 units/min x 30 min / (1(2.22 units/min x0.25 min/unit)) = 150 units.Q5.6Kinga Dolla)The process capacity of molding = 500 / (15+(.25*500)) = 3.57 dolls/minute = 214.9dolls/hour.The process capacity of painting = 500 / (30+(.15*500)) = 4.76 dolls/minute = 285.7dolls/hour.The process capacity of dressing = 1/.3 = 3.33 dolls/minute = 200 dolls/hour.Therefore, the process capacity =200 dolls/hour.b)For molding the target batch size =Target capacity x Setup time / (1(Target capacity xProcessing time)) =3.33 dolls/min x15min / (1(3.33 dolls/min x 0.25 min/doll)) =300 dollsFor painting the target batch size =Target capacity x Setup time / (1(Target capacity xProcessing time)) =3.33 dolls/min x30min / (1(3.33 dolls/min x 0.15 min/doll)) =200 dollsTherefore, the optimal batch size =300 units.(If the smaller batch size were selected,then molding’s capacity would be too low.)c)The flow rate is the minimum of the process capacity, which is 3.33 dolls/minute or 200dolls/hour, and demand. We know demand = 4000 dolls/week, with a 40-hour workweek. Therefore, the demand = 100 dolls/hour, which is less than the process capacity.Therefore, the current flow rate = 100 dolls/hour or 1.67 dolls/minute.For molding the target batch size =Target capacity x Setup time / (1(Target capacity xProcessing time)) =1.67 dolls/min x15min / (1(1.67 dolls/min x 0.25 min/doll)) =42.9 dolls

Page 19

Solution Manual For Matching Supply with Demand: An Introduction to Operations Management, 4th Edition - Page 19 preview image

Loading page image...

Last revised May 20185-4For painting the target batch size =Target capacity x Setup time / (1(Target capacity xProcessing time)) =1.67 dolls/min x30min / (1(1.67 dolls/min x 0.15 min/doll)) =66.7 dollsAgain, choose the larger batch size so that the flow rate isn’t decreased 0-the optimalbatch size is 66.7.Q5.7PTesta)PTest can test 300 samples in 12*300/60+30=90min=1.5hour. The capacity is 300samples/1.5hours=200samples/hour.b)The smallest batch size that achieves a flow rate of 2.5 samples per minute is2.5 * 30/(1-12/60*2.5)=150samples.c)The numberof basic tests per minute = 70 / (15/60 * 70 + 1.5*30+20)=70/82.5=0.848Q5.8Gelatoa)Each batch consists of a set of three flavors. The total setup time is ¾ + ½ + 1/6 = 17/12hours. The desired flow rate is 10 + 15 + 5 = 30 kgs/hr. The processing time is 1/50hrs/kg. The desired batch size for the set of three is 30 x 17/12 / (1-30 x 1/50) = 106 kgs.b)Fragola is 10/30ths of demand, so produce (10/30) x 106 = 35.33 kgs of fragolac)Chocolato is 15/30ths of demand, so the chocolato batch is (15 / 30) x 106 = 53 kgs. Theflow rate of chocolato is 15kgs/hour. The Processing time for chocolato is 1/50 hr/kg. Soaverage inventory = ½ x Batch size (1-Flow rate x Processing time) = ½ x 53 x (1-15 x1/50) = 18.55.Q5.9 Carpeta)The flow unit is a yard of carpet. Total demand=100+80+70+50=300yrds/hr. Setup time=4 carpets x 3 hr per carpet =12hr.Processiong time=1hr/(350yrds/hr)=0.002857hr.Target batch size ==12hr*300yrds/hr/(1-300yrds/hr*0.002857hr)=25200yrds. Of thecarpet produced per production cycle, 100/300thof it is carpet A. Hence, batch sizeofcarpet A=25,200*100/300=8400b)Batch size for carpet A is 16,800. Flow rate for carpet A is 100 yards/hr and theProcessing time is 1/350 hr /yard. Thus, Averageinventory = ½ x Batch size (1-Flowrate x Processing time) = ½ x16,800x (1-100x 1/350) =6,000 yards.Q5.10Catfooda)Holding costs are $0.50 * 15% / 50 = 0.0015 per can per week. Note, each can ispurchased for $0.50, so that is the value tied up in inventory and therefore determines theholding cost. The EOQ is then21600015.0500*7*2=T.b)he ordering cost is $7 per order. The number of orders per year is 500/EOQ. Thus, ordercost=62.1500*7=EOQ$/week=81$/year.

Page 20

Solution Manual For Matching Supply with Demand: An Introduction to Operations Management, 4th Edition - Page 20 preview image

Loading page image...

Last revised May 20185-5c)The average inventory level is EOQ/2. Inventory costs per week are thus0.5*EOQ*0.0015 = $1.62. Given 50 weeks per year, the inventory cost per year is $81.d)Inventory turns=Flow rate / InventoryFlow Rate= 500 cans per weekInventory=0.5 * EOQThus, Inventory Turns= R / (0.5*EOQ) = 0.462 turns per week = 23.14 turns per year.Q5.11Beer DistributorThe holding costs are 25% per year=0.5% per week=8*0.005=$0.04 per weeka)EOQ=6.22304.010*100*2=b)Inventory turns = Flow Rate / Inventory = 100 x 50 / (0.5 x EOQ) = 5000 / EOQ = 44.7turns per year.c)Per unit inventory cost =unit/$089.010010*04.0*2=d)You would never order more than Q=600For Q=600, we would get the following costs: 0.5*600*0.04*0.95 + 10*100 / 600 = 13.1The cost per unit would be 13.1/100=$0.131The quantity discount would save us 5%, which is $0.40 per case. However, ouroperating costs increase by $0.131-0.089 = $0.042. Hence, the savings outweigh thecost increase and it is better to order 600 units at a time.Q5.12Millenium LiquorsThe fixed cost of refrigeration can be ignoredbecause that cost does not change as wevary our order quantity.a)Weekly holding cost15%/50 perweek* 120 $/case = 0.36 $/week.b)The ordering cost is $290+$10 = $300.EOQ=9.27336.045*300*2=cases per order.c)We would get slightly lower ordering costs, which results in more frequent orders andlower inventoryQ5.13Powered by KoffeeThe holding costs are $1.50 per month ($1 storage and $0.50 capital)a)EOQ=27.755.150*85*2=

Page 21

Solution Manual For Matching Supply with Demand: An Introduction to Operations Management, 4th Edition - Page 21 preview image

Loading page image...

Last revised May 20185-6b)Order frequency:(12 * 50) /EOQ= 8 times per yearc)Average inventory is EOQ/2. So months of supply=(EOQ / 2) /50 = 0.75 monthsd)inventory costsper month=(EOQ / 2)* 1.50 = 56.46 $ /monthe)The monthly holding cost per bag is $1 + 0.02 x 20 = 1.4.Annual purchase quantity is 12x 50 = 600 bags.The average inventory will be 600 / 2 = 300, and so the monthly holdingcost is 300 x $1.4=$420. Theyearly holding cost is 12 x $420= $5040.The annualpurchase cost is600 x $20= $12,000.The totalannualcost of this option is $12,000 +$500 +$5040= $17,540.The current system operates at costs of 12*5.1*50*85*2+600 x25=16,355Thus, theoriginal system is cheaper.

Page 22

Solution Manual For Matching Supply with Demand: An Introduction to Operations Management, 4th Edition - Page 22 preview image

Loading page image...

Last revised May 20186-1Matching Supply with Demand: An Introduction to Operations Management4eSolutions to Chapter ProblemsChapter 6The Link between Operations and FinanceQ6.1.Crazy Caba)see tree belowb)see tree belowc)Value drivers include the % of distance driven empty, the number of trips per day, andthe distance of the trip. This is a high fix cost business with lots of capital, thus the morerevenue you can squeeze out of the cabs, the more money you make.And interestingissue would be to see if by reducing the time the cab drives empty, one could increase thenumber of trips furtherd)Similar to the airline ratios discussed previously.We can look at labor efficiency as:Revenue/ labor cost = Revenue / mile * miles/trip* trips / day* days/ labor costThe first ratio is the pricing power, the second the length of a trip, the third how many tripswe get out of a cab, and the fourth is a measure of wage rates.

Page 23

Solution Manual For Matching Supply with Demand: An Introduction to Operations Management, 4th Edition - Page 23 preview image

Loading page image...

Last revised May 20186-2Return onInvestedCapital46%Margin$644kInvestedCapital$1.4MRevenue$2.336MCost$1.4M (labor)+$292k (fuel)WorkingcapitalFixedcapitalTrips per cab: 40 trips/day*365days/year# of cabs: 20Price pertrip# of tripsPrice per mile: $2Fixed fee: $2Distance: 3 milesFuel&MntncecostLaborCost:20 drivers * 24hours/day * 8$/hour.driver*365days/yearNumber of cabs: 20Capital per cabNo information given in question;relatively smallCab: $20kMedaillon: $50KDistance:20 cabs*40 trips/day.cab*3 miles/trip**365days/year*(100/60)$0.20 per mile# of drivers: 20Hourly wage: $8
Preview Mode

This document has 76 pages. Sign in to access the full document!

Study Now!

XY-Copilot AI
Unlimited Access
Secure Payment
Instant Access
24/7 Support
Document Chat

Related Documents

View all