Solution Manual For Predictive Analytics for Business Strategy , 1st Edition

Struggling with textbook problems? Solution Manual For Predictive Analytics for Business Strategy, 1st Edition offers a clear breakdown of every exercise for easy understanding.

Lucas Taylor
Contributor
4.4
55
5 months ago
Preview (16 of 52 Pages)
100%
Purchase to unlock

Page 1

Solution Manual For Predictive Analytics for Business Strategy , 1st Edition - Page 1 preview image

Loading page image...

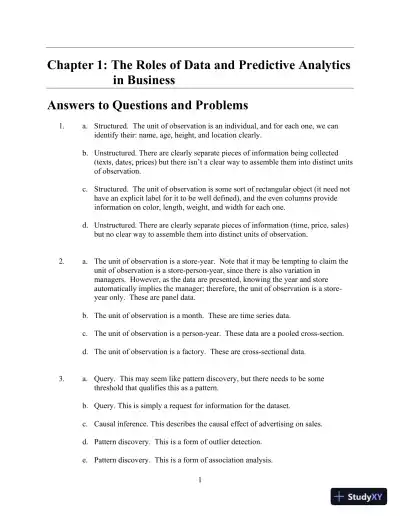
1Chapter 1:The Roles of Data and Predictive Analyticsin BusinessAnswers toQuestions andProblems1.a.Structured.The unit of observation is an individual, and for each one, we canidentify their: name, age, height, and location clearly.b.Unstructured.There are clearly separate pieces of information being collected(texts, dates, prices) but there isn’t a clear way to assemble them into distinct unitsof observation.c.Structured.The unit of observation is some sort of rectangular object (it need nothave an explicit label for it to be well defined), and the even columns provideinformation on color, length, weight, and width for each one.d.Unstructured.There are clearly separate pieces of information (time, price, sales)but no clear way to assemble them into distinct units of observation.2.a.The unitof observation is a store-year.Note that it may be tempting to claim theunit of observation is a store-person-year, since there is also variation inmanagers. However, as the data are presented, knowing the year and storeautomatically implies the manager; therefore, the unit of observation is a store-year only.These are panel data.b.The unitof observation is a month. These are time series data.c.The unit of observation is a person-year. These data are a pooled cross-section.d.The unit of observation is a factory. These arecross-sectional data.3.a.Query.This may seem like pattern discovery, but there needs to be somethreshold that qualifies this as a pattern.b.Query.This is simply a request for information for the dataset.c.Causal inference.This describes the causal effect of advertising on sales.d.Pattern discovery. This is a form ofoutlier detection.e.Pattern discovery. This is a form of association analysis.

Page 2

Solution Manual For Predictive Analytics for Business Strategy , 1st Edition - Page 2 preview image

Loading page image...

Page 3

Solution Manual For Predictive Analytics for Business Strategy , 1st Edition - Page 3 preview image

Loading page image...

24.Lead information pertains to whatwillhappen and lag information pertains to whatdidhappen.5.Passive predictioninvolves predicting outcomes while observing, but not altering,their determining factors. Active prediction involves predicting outcomes afteraltering at least one of their determining factors.6.a.ActivepredictionTom exogenously alters his diet.b.PassivepredictionAnndoes notdirectly alter the number of visits to her site.c.ActivepredictionLaura exogenously alters her advertising.d.PassivepredictionAlexdoes notdirectly alter people’s credit card purchasing.e.Passive predictionJohn does not directly alter the voter’s answers.7.As stated in the text, it allows the decision-maker to makeevidence-basedassessments of expected outcomes from alternative strategies, and thenchoose theoptimal one based on her business objective.8.a.i.A theoretical refute may be as simple as follows. Based on your own sense ofthe matter, people find the ads entertaining, but not enough to substantiallyrespond in terms of purchasing. Therefore, the change in sales will not beenough to offset the costs of the ads, meaning increased adexpenditure willlower profits.ii.You collect data on varying levels of ad expenditure along with profits acrosslocationsand/or time. Then, using techniques described in later chapters, youanalyze how profits respond to changes in ad expenditure in the data.If theanalysis shows profits decliningwith increasesin ad expenditure, this wouldconstitute a refutation to the claim.b.Data consist of what actually occurred, allowing for evidence-based decision-making, rather than “gut”-based decision-making.9.Here, we need three factors that we believe have a causal effect on the number ofyears an employee stays with a firm. Three such factors might be:1.Education (which might influence the employee’s competing options)

Page 4

Solution Manual For Predictive Analytics for Business Strategy , 1st Edition - Page 4 preview image

Loading page image...

32.Number of nearby rival firms (also may influence the employee’s competingoptions)3.Age when hired (which may be indicative of the employee’s job mobility)10.Following the example in the text, we can formally express the data generatingprocess for weekly soda sales as:𝑆𝑎𝑙𝑒𝑠𝑡=𝑓(𝑃𝑟𝑖𝑐𝑒𝑡,𝑃𝑙𝑎𝑐𝑒𝑚𝑒𝑛𝑡𝑡,𝐻𝑜𝑙𝑖𝑑𝑎𝑦𝑡)+𝑈𝑡.11.a.Thisdoes not require active prediction. Rather, it is a good example of anapplication of passive prediction. We want to predict how purchases relate to age,and we are not making changes to our customers’ ages.b.Thisdoes require active prediction. We are considering making an active changein strategyin the form of a new celebrity endorsementand we want to predicthow sales will respond.c.Thisdoes require active prediction. We are actively changing product placement(a strategic move), and want to know the impact on profits.12.Amanda is making the active prediction. She is determining what will happen with achange in strategy (i.e., a price cut). In comparison, Darryl is makinga passiveprediction. He is using demographicswhich Meredith is not considering, orcapable of, changingto predict the likelihood of an accident.13.SeeDataLoad.xlsxfor the data loading, or the table below provides an example.The unit of observation is a person-year. The data are panel data.

Page 5

Solution Manual For Predictive Analytics for Business Strategy , 1st Edition - Page 5 preview image

Loading page image...

414.(a,b,c): SeeScorecard Answer.xlsx15.a.i.$1,468,424.42ii.11,526,750.78iii.3,579,884.506iv.$51,439.46v.$353,890,286.00b.Two candidates include mean of Materials Costs ($21,161.41) and Variance ofLabor Costs ($87,892,572).16.a.$1,481,100.02b.$504,655c.Region 166d.Region 223e.$2,397,435-$500,776 = $1,896,65917.a.Thereis a strong positive correlation between a customer being active and theirage level. Hence, it appears younger customers are most likely to drop. This islead information since it is designed to look ahead and assess where the greatestrisks of customer loss will be in the future.b.TheNorth Region had the most customers (84). This is lag information, since itis simply reporting what happened.

Page 6

Solution Manual For Predictive Analytics for Business Strategy , 1st Edition - Page 6 preview image

Loading page image...

1Chapter 2:Reasoning with DataAnswers toQuestions andProblems1.Reasoning is the process of forming conclusions, judgments, or inferences from factsor premises.2.a.Inductive reasoning.You are starting with a specific observation and ending witha general conclusion.b.Deductivereasoning.You are starting with an assumption and ending with aconclusion.c.Deductive reasoning.You are starting with an assumption and ending with aconclusion.d.Inductivereasoning.You are starting with a specific observation and ending witha general conclusion.3.a.Ifa demand curve is downward sloping, then quantity demanded is alwaysdeclining with increases in price by definition. A change in price from $20 to $25is a price increase, and so must result in a decline in quantity demanded. Sincequantity demanded was 4,000 before the price increase, it must be less than 4,000after the price increase.b.Suppose increasing price from $20 to $25 resulted in sales at least as high as4,000. Then, this represents a price increase where quantity demanded did notfall. This means that the demand curve is not downward sloping, at least acrossthese price points; hence, demand cannot be generally characterized asdownward-sloping.4.There is one definitive problem with this argument:There is no basis for the degreeof support being 1%. In other words, this is a subjective degree of support. Anadditional possible problem is that the results from early polling may be a selectedsample consisting of people relatively in favor of, or against, a candidate compared tothe mean overall.This would potentially invalidate any conclusions that are based onan assumption of a random sample.

Page 7

Solution Manual For Predictive Analytics for Business Strategy , 1st Edition - Page 7 preview image

Loading page image...

25.Reasoning provides the framework that allows all involved to clearly see how to gofrom a dataset to a meaningful conclusion. Reasoning allows for a rigorousargument, in contrast to using instincts or feelings.6.a.Thisis neither a direct proof nor transposition. Here, we are trying to prove thestatement by claiming “If B, then A,” where B is “our margins will increase” andA is “we target our advertising to a younger audience.” Showing B implies Adoes not necessarily mean A implies B, so this is not a valid proof.b.Thisis transposition. Here, we are assuming the opposite of the conclusion andshowing the assumption cannot hold.c.Thisis a direct proof. We start with the assumption and move directly to theconclusion.7.a.Transposition.By walking backward from assuming the conclusion is not true, weare forced to think through the set of assumptions that might consequently berefuted.b.Onesimple hidden assumption is that the targeted advertising is effective for ayounger audience. If the younger audience does not respond to the targetedadvertising, the proof breaks down.8.An empirically testable conclusion resulting from your friend being a faster sprinter isthat your friend would defeat you in a sprinting race. You could then test thisconclusion by actually running the race and see who wins.9.These data likely suffer from both collector selection bias and member selection bias.For collector selection bias, the people in the data being collected are those that themanager has not let go from the firm; hence, there is selection in terms of whichemployees the manager allows to stay. For member selection bias, the employees inthe data are those who chose to stay with the firm and not go work somewhere else.Both types of selection, which are likely present in these data, could lead to biasedconclusions about the average monthly sales for new hires in general.10.A subjective degree of support is based on opinion and does not have a statisticalfoundation. In contrast, an objective degree of supportdoes have a statisticalfoundation. Hence, the objective degree of support is grounded in an associatedstatistical model that generates concrete figures capturing the level of certainty.

Page 8

Solution Manual For Predictive Analytics for Business Strategy , 1st Edition - Page 8 preview image

Loading page image...

311.a.Inductive reasoning.b.Deductive reasoning.c.Inductivereasoning.12.a.This isempirically testable. You can have the teams play any number of times,and compare the proportion of wins for Team A to 65%.b.This is notempirically testable. Bruce Lee did not compete in the 1970tournament, and we cannot go back to observe his performance if he had. Hence,there are no observations currently available, or possible to collect, that couldevaluate this conclusion.c.This is empirically testable. You can observe profits at each store next year, andcompare the proportion of stores that had increased profits to 75%.13.Observe the car salesman’s number of sales for the next five customers in the store.If he makes no sales, you could inductively reason that he does not in fact have a 50%success rate in general.14.a.Theempirically testable conclusion consists of the probabilities in the table. Forexample, if your assumption holds, the probability of 8 correct picks is 4.4%.b.You couldtest this conclusion by comparing the number of correct picks thebroker makes against the probabilities. In particular, if you observed a very high(e.g., 9 or 10) or very low (e.g., 0 or 1) number of correct picks, you may questionwhether this conclusion is accurate.c.The line of reasoning is as follows. First, using deductive reasoning, we go fromthe assumption of a50% likelihood of success to the probability table in theproblem, which is the empirically testable conclusion.Next, using inductivereasoning, we observe the number of correct picks and decide whether or not toreject the probability table as being true. Last, if we decide to reject theprobability table, we use deductive reasoning (in the form of transposition) toreject the assumption of a 50% likelihood of success.15.One possible source of selection bias is via collector selection bias. The broker mayhave sent you picks for stocks for which she had some inside knowledge, and shemay not generally possess this type of knowledge when making picks. Anotherpossible source of selection bias is member selection bias.A clever scamartist wouldsimply make all 210possible combinations of stock picks and send each different set

Page 9

Solution Manual For Predictive Analytics for Business Strategy , 1st Edition - Page 9 preview image

Loading page image...

4of picks to 210different people. Then, the picks you receive is a selection of one setof picks out of the210that were actually made. You are then basing your reasoningon the one set of picks you observed, and not the full sample of picks that were made.

Page 10

Solution Manual For Predictive Analytics for Business Strategy , 1st Edition - Page 10 preview image

Loading page image...

1Chapter 3:Reasoning from Sample to PopulationAnswers toQuestions andProblems1.a.The samplemean is the sum of all 16 numbers divided by 16, which is 24.06.b.The samplestandard deviation is the square root of the sample variance. Thesample variance is1𝑁1(𝑥𝑖𝑋)2𝑁𝑖=1=115(𝑥𝑖24.06)216𝑖=1=166.46.Therefore, the sample standard deviation is12.90.c.They areestimators for the population mean and population standard deviation,respectively.d.Anunbiased estimator, informally, is a “reasonable guess” for its correspondingpopulation parameter. More formally, an unbiased estimator is one where itsexpected value is equal to its corresponding population parameter.2.You potentially have a non-random sample, since only a subset of the 1,000customers you sampled gave you a response. This sample may consist of peoplemore willing to reveal their income, and it’s reasonable to think this group may tendto be those who have a good income. In that case, the sample mean will be a biasedestimate of the population mean (in this case, likely biased upward), and theconfidence interval will span numbers that are too high.3.a.The90% confidence intervalfor the clickthrough rate is0.12±1.65(0.3252271).Rounding to the nearest thousandth, we have a 90% confidence interval of(0.109,0.131).b.Thisconfidence interval means that we are 90% confident that the population-level click through rate isbetween 0.109and 0.131. Put another way, if we tookmany samples and constructed the confidence interval the same way as we did forpartaeach time, 90% of those intervals would capture the population-level clickthrough rate.c.Thiswould mean our assumption of a sample size over 30 is no longer correct.This doesn’t mean our confidence interval is necessarily wrong; however, theconfidence level we place on it depends on our ability to apply the central limittheorem, which we can no longer do.4.a.Thet-stat is (0.07-0.075)/(0.256/sqrt(341)) =-0.361.

Page 11

Solution Manual For Predictive Analytics for Business Strategy , 1st Edition - Page 11 preview image

Loading page image...

2b.Thet-stat is thetest statistic corresponding to the sample mean which is then usedto conduct hypothesis tests.c.The p-valuefor this t-stat is 0.719.d.The p-value is the probability of observing a draw from a t-distribution that is atleast as extreme (far from zero) as the t-stat we observed.5.See the graph below for the answers to a & b6.a.The95% confidence interval will be wider. To construct it, you take 1.96standard deviations in each direction, as opposed to 1.65 standard deviations.Conceptually, this makes sense as wellyou need the confidence interval toinclude more values in order to have a higher level of confidence that it containsthe population parameter.b.A 100% confidence interval is the entire real line. Conceptually, in order to be100% confident that the confidence interval contains the population parameter,we have to allow for all possible values.7.a.Notethat 26.2 is the sample mean. Also, recall that the p-value in this case is theprobability of seeing a number at least as extreme as the sample mean when thenull is true. Since the sample mean is equal to the hypothesized population mean,every number is at least as extreme as what we saw (we can’t get less extremethan seeing the population mean!). Therefore, the p-value is 1.0, or 100%.p-value2026.213.8𝑋

Page 12

Solution Manual For Predictive Analytics for Business Strategy , 1st Edition - Page 12 preview image

Loading page image...

3b.No.With a p-value of 1.0, we would never reject this null, no matter the degreeof support we choose. This is sensible, since there is no basis for rejecting thehypothesized population mean if the sample mean exactly equals it.8.Following Reasoning Box 3-5, deductive reasoning plays a role in two places. First,it plays a role in the final prediction. Assuming the causal relationship between priceand revenues is about $207,500 per $1 increase (taking the mid-point of theconfidence interval), it is immediate to conclude what a $2 increase in price will do.Second, it plays a role in establishing the causality between price and revenue and thedistribution of an estimator for the magnitude of this causal relationship in thepopulation. Specifically, we must make assumptions that imply both causality andthe distribution of our estimator for the effect of price on revenue.9.Refer to theSoda_Answer.xlsxfile.a.This is the null hypothesis.b. Using thesample mean, sample standard deviation, and sample size, the t-stat is(2.692.58) / (0.439 / sqrt(35)) = 1.547.c.Thep-value is 0.131.d.The t-stat islessthan 1.65, so wefail toreject the null with 90% confidence.e.The p-value is more than0.10, so we fail to reject the null with 90% confidence.f.No. The values for the t-stat that lead to rejection using 90% confidence exactlycorrespond to the values for the t-stat that would generate a p-value of less than0.10.10.Refer to theWebVisits_Answer.xlsxfile.a.Using the data, calculate the sample standard deviation and divide by the squareroot of the number of observations, yielding approximately 0.043.Then, take themean duration (approximately 8.504), and add and subtract 1.65 × 0.043 to get theconfidence interval. Hence, the90% confidence interval is (8.433,8.575).b.Using the data, calculate the sample standard deviation and divide by the squareroot of the number of observations, yielding approximately 0.043.Then, take themean duration (approximately 8.504), and add and subtract 1.96 × 0.043 to get theconfidence interval.Hence, the 95% confidence interval is (8.419,8.588).

Page 13

Solution Manual For Predictive Analytics for Business Strategy , 1st Edition - Page 13 preview image

Loading page image...

4c.Using the data, calculate the sample standard deviation and divide by the squareroot of the number of observations, yielding approximately 0.043.Then, take themean duration (approximately 8.504), and add and subtract 2.58 × 0.043 to get theconfidence interval. Hence, the 99% confidence interval is(8.392,8.615).d.A possible issue with these confidence intervals is that the sample data may not bea random sample. The question is whether there is anything “special” about themonth during which you collected the data. For example, if there is greater visitintensity during the Holiday Season, then using the month of December maygenerate a sample mean that is not an unbiased estimator of the population mean.11.Refer to theWebProfits_Answer.xlsxfile.a.The99% confidence interval is (8.898,9.813).b.i.Thet-stat is-12.08.ii.Thep-value is 3.95 x 10⁻³³an extremely small number.iii.The p-valueis far less than 0.05, so reject 11.5 as the mean profit per visitfor all visits.iv.Ifwe assume the sample data is a random sample from the population, andgiven the sample size is large (easily more than 30), we can use the samplemean, sample standard deviation and sample size to calculate the t-stat.The p-value is the probability we would observe a t-stat at least as large(in absolute value) as the one we did observe, given the mean profit pervisit in the population were $11.50. Since this is less than 0.05, we rejectthe claim that the population mean profit per visit is $11.50.12.Refer to theWebProfits_Answer.xlsxfile.a.The t-stat requires us to calculate the mean of Profit (approximately 9.356) andthe sample standard deviation (approximately 12.215).Then, the t-stat is (9.3569) / (12.215 /sqrt(4738)) = 2.004.b.To get the area in the tails of a standard normal distribution (above 2.004 andbelow-2.004), we use (1-2 × norm.s.dist(2.004,true)) in Excel.The p-value is0.045.c.Since the confidence level is 99%, we compare the p-value to 0.01 (199/100).Here, the p-value is more than 0.01, so we fail to reject the null hypothesis. Thismeans we cannot reject that the mean profit per visit for all visitors is $9.00.

Page 14

Solution Manual For Predictive Analytics for Business Strategy , 1st Edition - Page 14 preview image

Loading page image...

5d.If we assume the sample data is a random sample from the population, and giventhe sample size is large (easily more than 30), we can use the sample mean,sample standard deviation and sample size to calculate the t-stat. Thep-value isthe probability we would observe a t-stat at least as large (in absolute value) as theone we did observe, given the mean profit per visit in the populationwere $9.00.Since this is more than 0.01, wefail toreject the claim that the population meanprofit per visit is $9.00.

Page 15

Solution Manual For Predictive Analytics for Business Strategy , 1st Edition - Page 15 preview image

Loading page image...

1Chapter 4:The Scientific Method: The Gold Standardfor Establishing CausalityAnswers toQuestions andProblems1.Option c) Collect market data. As we’ve seen in the chapter, market data per se is notwell suited for thescientific method, since it rarely is generated via a controlledexperiment.2.A correct answer here will have components comparable to those for the businessexample in the text. A brief outline is as follows:Step 2 (Do background research): Learn more about the posed question, e.g., byrunning consumer surveys.Step 3(Formulate a hypothesis): Propose what the relationship between the variablesis, e.g., an increase in X decreases Y.Step 4(Run an experiment): Randomly assign different values of X and observe howthe corresponding values of Y.Step 5(Analyze the data and draw conclusions): Build confidence intervals and/orconduct a hypothesis test designed to evaluate your hypothesis, and draw conclusionsas to whether the data support the hypothesis or not.Step 6(Communicate the findings): Explain the methodology and findings from yourexperiment.3.The effect of the treatment on the treated is the expected change in the outcome fromreceiving the treatment for the group ofparticipants actually receiving the treatment.The average treatment effect is the expected change in the outcome from receivingthe treatment for the entire population, regardless of their actual treatment status.4.a.The flaw is that the two days for which she observed price and profits are notidentical to the day for which she wants to measure the effect of a price change(i.e., treatment effect). Put another way, she would like to know ProfitsiTProfitsiNT, but instead has ProfitsjTProfitskNT, where i stands for her storetomorrow, and j and k stand for her store on the two days where she observedprice and profits.

Page 16

Solution Manual For Predictive Analytics for Business Strategy , 1st Edition - Page 16 preview image

Loading page image...

2b.She would like to observe profits tomorrow when price is unchanged (ProfitsiNT),and then go back and observe profits on the exact same day when price is 10%higher (ProfitsiT), and then take the difference.Of course, it is not possible to dothis.5.a.This isnot an example of zero selection bias. Rather, this is an example of adifferential treatment effect across subgroups of the population.b.This is an example of zero selection bias. Mondays and Wednesdays have thesame expected outcome when receiving no treatment.c.This is not anexample of zero selection bias. This just states that the averageoutcome is the same for the treated and untreated.6.a.This is an example of ETT ≠ ATE. Those receiving the coupon responddifferently to it than the general population.b.This is not an example of ETT ≠ ATE. Rather, this is an example of a nonzeroselection bias.c.This is not an example of ETT ≠ ATE. Rather, this is an example of zeroselection bias.7.Non-experimental data almost always involve a non-randomly assigned treatment. Ifthe treatment is instead assigned in a way that those receiving the treatment aredifferent than those who don’t (e.g., because they respond differently and/or havedifferent expected outcomes with no treatment), then we will get a biased estimate ofthe treatment effect using standard techniques.8.Managers generally are not making strategic decisions randomly, but optimally, oftento maximize profits. For example, they may tend to make strategic decisions so thattreatments (e.g., price discounts) are assigned where they will be most profitable(ETT > ATE), or possibly in markets that currently have the least profits (SelectionBias < 0).9.Yes, it implies there is selection bias, and it is greater than zero. That is, firms thatreceived the treatment (Google advertising) have higher sales than firms not receivingthe treatment in the case where neither group gets the treatment.Hence, the selectedtreatment assignment is precluding us from measuring the ATE by simply comparingthe average sales for the treated to the average sales for the untreated.
Preview Mode

This document has 52 pages. Sign in to access the full document!

Study Now!

XY-Copilot AI
Unlimited Access
Secure Payment
Instant Access
24/7 Support
Document Chat

Document Details

Related Documents

View all