Solution Manual For Production And Operations Analysis, 6th Edition

Solution Manual For Production And Operations Analysis, 6th Edition is your study companion, providing answers to textbook exercises and reinforcing key concepts.

Jackson Roberts
Contributor
4.4
41
5 months ago
Preview (16 of 469 Pages)
100%
Purchase to unlock

Page 1

Solution Manual For Production And Operations Analysis, 6th Edition - Page 1 preview image

Loading page image...

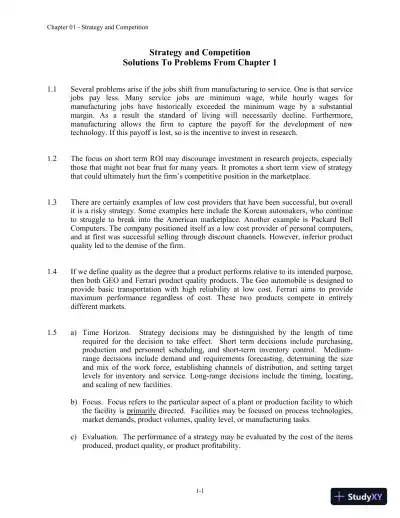
Chapter 01-Strategy and Competition1-1Strategy and CompetitionSolutions To Problems From Chapter 11.1Several problems arise if the jobs shift from manufacturing to service. One is that servicejobspayless.Manyservicejobsareminimumwage,whilehourlywagesformanufacturing jobs have historically exceeded the minimum wage by a substantialmargin.Asaresultthestandardoflivingwillnecessarilydecline.Furthermore,manufacturing allows the firm to capture the payoff for the development of newtechnology. If this payoff is lost, so is the incentive to invest in research.1.2The focus on short term ROI may discourage investment in research projects, especiallythose that might not bear fruit for many years. It promotes a short term view of strategythat could ultimately hurt the firm’s competitive position in the marketplace.1.3There are certainly examples of low cost providers that have been successful, but overallit is a risky strategy. Some examples here include the Korean automakers, who continueto struggle to break into the American marketplace. Another example is Packard BellComputers. The company positioned itself as a low cost provider of personal computers,and at first was successful selling through discount channels. However, inferior productquality led to the demise of the firm.1.4If we define quality as the degree that a product performs relative to its intended purpose,then both GEO and Ferrari product quality products. The Geo automobile is designed toprovide basic transportation with high reliability at low cost. Ferrari aims to providemaximum performance regardless of cost. These two products compete in entirelydifferent markets.1.5a)Time Horizon.Strategy decisions may be distinguished by the length of timerequired for the decision to take effect.Short term decisions include purchasing,production and personnel scheduling, and short-term inventory control.Medium-range decisions include demand and requirements forecasting, determining the sizeand mix of the work force, establishing channels of distribution, and setting targetlevels for inventory and service. Long-range decisions include the timing, locating,and scaling of new facilities.b)Focus. Focus refers to the particular aspect of a plant or production facility to whichthe facility isprimarilydirected.Facilities may be focused on process technologies,market demands, product volumes, quality level, or manufacturing tasks.c)Evaluation. The performance of a strategy may be evaluated by the cost of the itemsproduced, product quality, or product profitability.

Page 2

Solution Manual For Production And Operations Analysis, 6th Edition - Page 2 preview image

Loading page image...

Page 3

Solution Manual For Production And Operations Analysis, 6th Edition - Page 3 preview image

Loading page image...

Chapter 01-Strategy and Competition1-2d)Consistency.A strategy should be aimed towards optimizing few objectives anddifferent segments of POM strategy should not compete along different dimensionsand lead management and labor to assume conflicting objectives.1.6Advantages:The primary advantage is that the costs of new facilities can be saved. Also,there may be logistic benefits if new products interact with existing ones or existingequipment can be utilized to produce the new products.Disadvantages:Old facilities may use outmoded technology, be located in undesirableareas, or may have already reached capacity. Furthermore, by locating new processes inexisting facilities, the plant may lose focus.1.7a)The focus of the current facility will be compromised.b)The Operations V.P. may be taking a short-term view that could be costly to the firmin the long run.c)InordertomaximizethecurrentROI,theCFOhaschosentolimitcurrentinvestment. This could be a poor long-run strategy decision.d)The reliability requirements for the second application are likely to be much higher.The firm should consider producing these products in different plants.1.8They are: 1) Factor Conditions, 2) Demand Conditions, 3) Related and SupportingIndustries, and 4) Firm Strategy, structure, and rivalry. Examples: 1: An industry that hasprospered from factor conditions in the United States is the forest products industry. 2:Sony has benefited from the interest and willingness of Japanese consumers to try newelectronic gear. Pharmaceutical companies are very successful in the United States due tothe large population, and significant funds spent on health care. 3: Silicon Valley aboundswith examples of firms that have done well because they are closely related to otherstrongindustries.OneexampleisAppliedMaterialsthatproducessemiconductorfabrication and testing equipment. 4: Finally, one of the reasons for Toyota's success isthe willingness of top management to employ the latest manufacturing thinking.1.9Because aluminum is highly energy intensive, production costs are closely tied to energycosts. In the United States, the Pacific Northwest has abundant hydroelectric power, oneof the least expensive means of generating power.

Page 4

Solution Manual For Production And Operations Analysis, 6th Edition - Page 4 preview image

Loading page image...

Chapter 01-Strategy and Competition1-31.10The effect of foreign competition has been devastating for many major industries in theUnited States. At one time the U.S. dominated world steel production. Today most of themajor steel mills in the U.S. have closed. The domestic clothing and textile industrieshave suffered as a result of overseas competition. And, as we all know, the Americanauto companies have lost significant market share to overseas competitors.1.11Several industries in the United States have felt the sting of foreign competition in caseswhere overseas firms may be subsidized (such as Airbus), or use their strong position inthe marketplace to "dump" products (such as the dumping of D-RAMS by the Japanese inthe 1980's). Our government must be sure that a "level playing field" is maintained at alltimes. While the issues raised in this and the preceding question are subject to debate, it isthe belief of this writer that international competition remains an important concern.1.12Pros:Labor costs could be considerably cheaper in the location where markets arelocated. Also: transportation costs and transportation lead times are reduced. In addition,there may be tax incentives provided by the host country.Cons:New manufacturing facilities must be constructed with attendant capital costs.The labor force in the new location may require special training. Also, it might be moredifficult for the management to keep close tabs on the operation of an assembly plant farfrom the firm’s center of operation.1.13Quality may be defined as the degree to which an item performs its intended purpose. Inthis way it is possible for the $75 TV to be a higher quality item than the one selling for$3,000.1.14Several reasons have been suggested for these differences. They includea)The Japanese have a better educated and more motivated work-force,b)The Japanese use the latest technological developments in their plants,c)Japanese management techniques are more effective in motivating employees to dotheir best.d)There are few labor unions in Japan.e)The Japanese can borrow funds at lower interest rates.f)Japanese industry receives support from the government.While there is probably some truth to all of these reasons, based on experiences in theUnited States, it would appear that Japanese management methods are far more effectivethan American methods.

Page 5

Solution Manual For Production And Operations Analysis, 6th Edition - Page 5 preview image

Loading page image...

Chapter 01-Strategy and Competition1-41.15Time based competition refers to getting a product to market before your competitors andgetting to volume production before your competitors as well. A company which has hadseveral commercial successes by introducing innovative products to the marketplace firstis Gillette. Gillette has had significant successes with its Atra and Sensor razors as well asthe Good News disposable razor line.1.16Getting to the market first is clearly not the only determinant of success. The phraserefers to the fact that the better quality product eventually captures the markets. Softwareis an example where "a better mousetrap" eventually dominates. Visicalc was the firstspreadsheet program, but was significantly improved upon by Lotus, whose program 1-2-3 dominated the market until it was also pushed aside by Microsoft's Excel. In wordprocessing, Wordstar was the CPM standard, later dominated by Wordperfect for PC's.Today Microsoft's Word is the best selling word processing program.1.17Many of the successes of BPR have followed the formula of reducing a complex processconsisting of many steps to a simpler one consisting of only a few steps. This was thecase of IBM Credit Corp.1.181.Computer-based simulation is useful for trying out process configurations withouthaving to actually effect changes on the operating system. 2. Flowcharting can help tounderstand how a process is currently working and where improvements can be made. 3.Re-engineeringcanonlyworkwithemployee“buy-in”anddirectinvolvement.Management structure is an important component to a successful re-engineering effort. 4.Mathematical models, like simulation, allow one to see the effects of re-engineering “offline.” 5. Cross-functional teams relate to a successful management effort and structure tofacilitate the re-engineering effort.1.19Both of these scenarios are clearly a recipe for failure. The re-engineering effort musthave support from both the management and the employee ends. Even with goodintentions on both sides, many efforts never reach successful implementation.1.20JIT vendor relationships allow the firm to arrange to receive goods as they are needed. Inthis way excess inventories of raw materials or subcontracted goods do not build up.Relationshipswithtoomanyvendorsmakesduplicationapotentialproblemandincreases the demands on the firm to keep an accurate track of the status of orders. JIT isparticularly effective for minimizing WIP inventory. WIP inventory occurs when toomuch inventory builds between processes. JIT is a system in which items are moved fromone work center to another only when requested, avoiding unreasonable build-ups of inprocess inventories.

Page 6

Solution Manual For Production And Operations Analysis, 6th Edition - Page 6 preview image

Loading page image...

Chapter 01-Strategy and Competition1-51.21In JIT systems, defective products are located quickly before large inventories ofdefectives have an opportunity to accumulate. By moving items in small lots through thesystem, JIT facilitates the quick recognition of quality problems so that they can becorrected before they get out of hand.1.22a)1.start-up2.rapid growth3.maturation4.stabilization or declineb)In most circumstances, it is inappropriate to operate very far off the diagonal.Forexample, a firm that produces a varied product line with a relatively low volume foreach product would not invest the capital required for the equipment to develop acontinuous flow production line. Similarly, a firm producing few products with highvolume would not choose a jumbled flow shop for manufacturing.1.23The automobile is one example of a product that has evolved through all phases of theproduct life cycle and has now reached a period of stabilization. Personal computers arean example of a product still in the maturation phase.1.24Although many firms should follow this pattern of evolution, it clearly does not makesense for all firms to do so.For example, the commercial printer shown in Figure 1.13will never evolve beyond a jumbled flow shop and never beyond being a low volumeone-of-a-kind producer.1.25a)I-Ib)IV-IVc)II-II (could be III-III depending on the product volume and diversity of productsproduced)d)III-IIIe)I-I1.26When workers or an industry gains additional experience with a process or product, theamount of time or money required to produce the product declines.In the case oflearning curves, workers become familiar with the process of production and the processitself is improved over time.With experience curves, the effect measured is theaccumulated experience of an entire industry.Thisexperience results in processimprovements and new technologies that ultimately reduce unit production costs.

Page 7

Solution Manual For Production And Operations Analysis, 6th Edition - Page 7 preview image

Loading page image...

Chapter 01-Strategy and Competition1-61.27A learning curve strategy is one in which the goal is to reduce costs along the linespredicted by the learning curve. By using a learning curve strategy, Ford was able toreduce unit costs to the lowest in the industry. However, this strategy stifled innovation atFord. Because they were focusing on unit production costs instead of changing customerpreferences, Ford allowed competitors to capture their dominant share of the market.1.28Unforeseen problems can arise in production of an item thus making extrapolation alongthe learning curve inaccurate. This was the experience of Douglas Aircraft.Unforeseendesign changes led to unit production costs higher than those predicted by the learningcurve.1.29Substituting u=100,000 into the relationshipY(u)=22.88u-.42276gives Y(100,000)=.1761 hours1.30a)ln(cum#units)ln(#hrsfornextunit)3.9121.194.6050.795.99106.397-.226.908-.699.210-1.61b)3.02.52.01.51.00.50.0-0.5-0.1-1.5-2.0ln(hours)12345678910ln(cumulative units)

Page 8

Solution Manual For Production And Operations Analysis, 6th Edition - Page 8 preview image

Loading page image...

Chapter 01-Strategy and Competition1-7c)The intercept is ln(a)a=e2.7=14.88ln(L)=-b ln(2)=(-.46)(.6931)=-.319L=e-.319=.727Hence, the first unit should require 14.88 hours and a 73% learning curve accurately fitsthis data.d)Exact values of the slope and intercept areslope=-0.53834intercept=3.2319based on the natural logarithms.Using these exact values, the first unit should requiree3.2319=25.33 hrs.Since ln(L)=-b ln(2)=(-.53834)(.693)=-.373L=e-.373=.689Hence, the first unit should require 25.33 hrs. and a 69% learning curve should accuratelyfit this data based on the estimated least squares fit of the data.1.31Using the exact least squares estimates from part (d) of problem 12, the learning curverelationship isY(u)=25.33u-.53834Substituting u=100,000 givesY(u)=(25.33)(100,000)-.53834=.0515 hrs.1.32Forming the ratio ofY2u()Y u( )for any value of u gives the percentage curve. Let u=10. Then from the Figure Y(10)=8.1 (approximately) and Y(20)=6.1. HenceY20()Y10()=6.18.1=.753We would estimate that this curve is about a 75% experience curve.

Page 9

Solution Manual For Production And Operations Analysis, 6th Edition - Page 9 preview image

Loading page image...

Chapter 01-Strategy and Competition1-81.331.They may not accurately describe all production processes or industry experience.2.Although they may be accurate within a given range, learning and experience curvesmay be inaccurate when the number of units produced grows large.3.These curves cannot reflect price fluctuations due to shortages of raw materials orunusual market conditions.4.Learning curves may also incorporate other effects such as economies of scale andtechnological improvements.1.34The curve is of the form Y(u)=au-bwhere a is the cost of producing the first unit and b=-ln(L)/ln(2).Here a=$1,000 and b=-ln(.80)/ln(2)=.3219a)Y(100)=(1000)(100)-.3219=$227.09b)Y(10,000)=(1000)(10,000)-.3219=$51.571.345a)Let K= 30,000c2= 20c1= 85Solve for x = K/(c1-c2) = (30,000)/(65) = 461.54 ~ 462b)c1x = (85)(462) = $39,270.00.c)x = (30,000)/(100-20) = (30,000)/(80) = 3751.36Cum.YearSalesNetRevenueNetRevenue11006,5006,50021409,10015,600319612,74028,340427417,81046,150Hence, it will require slightly over 3 years to recoup the $30,000.00 initial investment.Linear interpolation gives an exact answer of 3.11 years.1.37a)Since there are 4 wheels per carriage, the company uses 40,000 wheels annually.They will save 8-3.50 = $4.50 per wheel if they produce the wheels.This is$180,000.00 per year. Hence, it will require (800,000)/(180,000) = 4.44 years.

Page 10

Solution Manual For Production And Operations Analysis, 6th Edition - Page 10 preview image

Loading page image...

Chapter 01-Strategy and Competition1-9b)YearSales#WheelsCostSavingsCum.Savings110,00040,000$180,000$180,000211,50046,000$207,000$387,000313,22552,900$238,050$625,050415,20960,836$273,758$898,808Answer: between 3 and 4 years. Using linear interpolation, we obtain3.64 years.1.38a)From Figure 1.14, a value of a=.58 gives a value of u very close to 1.0. Solving x=u/r=1/.12=8.33years.TheoptimalsizeofeachadditionisxD=(8.33)(3,000)=25,000 tons.b)f(y)= .0205y.58=(.0205)(25,000).58-7.29.Hence, the cost of each new addition is $7.29 million.c)At 12% interest the effective annual discount rate is 1/(1+0.12) = .8929. Howeverreplacements are made once every 8.33 years giving a discount factor per replacementof (.8929)8.33= .3891. Hence, the present cost of the next four replacements is7.29[.39+(.39)2+(.39)3+(.39)4]=7.29[.6245]=$4.55 million1.39a)2a= 1.68a ln(2) = ln(1.68)a=1n1 . 68()1n2()= .7485.To find k substitute 6=k(10,000).7485k =610,000().7485= .0061b)Locating a=.7485 on Figure 1.14 gives a value of u of approximately 0.67.Solving: x=u/r=.67/.15=4.47 years.The optimal size of each new addition is (4.47)(2)=8.94 million barrels (per year).c)[(15,000)/day][365 days/year]=5,475,000.The optimal plant size=min [5.475million, 8.94 million]=5.475 million barrels per year.In this case, plants need to be added every5.4752= 2.7375years

Page 11

Solution Manual For Production And Operations Analysis, 6th Edition - Page 11 preview image

Loading page image...

Chapter 01-Strategy and Competition1-101.40In the chapter, a production and operations strategy is defined as the sum total of alldecisions related to production, storage, and distribution of goods and services. Thisrelates to decisions concerning the sizing and location of production facilities, inventorymanagement strategies, including JIT systems, strategies for getting to the marketquickly, and learning curve strategies to mention a few. Marketing is concerned withselling goods and finance with supplying the financial resources to implement themarketingandproductionstrategies.Individualfunctionalareastrategiesmustbecarefully coordinated with the overall business strategy of the firm.1.41The product life cycle refers to the way that sales change over time. The curve isdescribed typically in four phases: 1) start up, during which a relatively shallow salesgrowth is experienced while the product is getting known in the marketplace, 2) rapidgrowth, as the product gains acceptance in the marketplace, 3) maturation, during whichsales are relatively stable, and 4) stability or decline, depending on the type of product.The process life cycle refers to the characteristics of the manufacturing process duringthese stages. Initially, the manufacturing process might resemble a jumbled flow. This isthe early phase of the learning curve characterized by low volume orders. In the laterphase as product demand increases, automation begins to play a greater role. In the finalmature phase, standardized processes would be appropriate if the item experiences stableongoing demand.1.42b=-ln(L)/ln(2)=-ln(.73)/ln(2)=.4540.a=100 giving Y(u)=100u-.4540.It follows thatY(10,000)=(100)(10,000)-.4540=$1.53.1.43x=K/(c1-c2)=5,500,000/(3.00-1.20)=3,055,556 ties.1.44D=8,000 tons/yearr=.10a=.51From Figure 1.14, we obtainu1.25. It follows thatrx=1.25,giving x=1.25/.10=12.5 years.

Page 12

Solution Manual For Production And Operations Analysis, 6th Edition - Page 12 preview image

Loading page image...

Chapter 01-Strategy and Competition1-111.45QC(Q)BuyCostProCostPro+85013.69800003690853690214.1916000014194864194330.7324000030726880726452.5832000052579902579579.12400000791239291236109.794800001097909597907144.075600001440749940748181.5264000018152010315209221.72720000221723107172310264.32800000264322111432211308.99880000308995115899512355.45960000355454120545413403.441040000403444125344414452.741120000452740130274015503.141200000503140135314016554.471280000554467140446717606.561360000606565145656518659.291440000659294150929419712.531520000712535156253520766.181600000766179161617921820.141680000820135167013522874.321760000874321172432123928.671840000928666177866624983.1119200009831091833109251037.60200000010375981887598a)The function is a convex increasing function. For values of Q larger than about 10, itis essentially linear.b)Here we search the column C(Q) for the value closest to 1,000 (since we are toldC(Q) is in units of $1,000). This occurs at Q=24 to 25. Since Q is in hundreds ofunits we can interpolate to obtain Q=2432 units.c)Here we compare the third and last columns to determine the break-even quantity. Itoccurs at Q about half-way between 20 and 21. (Q = 2050 is a reasonable guess.)

Page 13

Solution Manual For Production And Operations Analysis, 6th Edition - Page 13 preview image

Loading page image...

Chapter 01-Strategy and Competition1-121.46YearCostPres.Val.11120001013422120960990343130637967784141088945745152375924206164565903157177730882588191948862489207304842841022388982364112418008048812261144786551328203576864143045987511315328966734021635528371730173837067009718414402685001944755466940204833596541521522027639262256378962470236088936104724657604596562571021258298267670295697027828392556722889466354405299662365316530104353551955total=2220384

Page 14

Solution Manual For Production And Operations Analysis, 6th Edition - Page 14 preview image

Loading page image...

Chapter 01-Strategy and Competition1-131.47QBuyCostProdCost200001000000870000040000200000094000006000030000001010000080000400000010800000100000500000011500000120000590000012200000140000680000012900000160000770000013600000180000860000014300000200000950000015000000220000104000001570000024000011300000164000002600001220000017100000280000131000001780000030000014000000185000003200001490000019200000`340000158000001990000036000016700000206000003800001760000021300000400000185000002200000042000019400000227000004400002030000023400000460000212000002410000048000022100000248000005000002300000025500000520000238000002620000054000024600000269000005600002540000027600000580000262000002830000060000027000000290000006200002780000029700000640000286000003040000066000029400000311000006800003020000031800000700000310000003250000072000031800000332000007400003260000033900000760000334000003460000078000034200000353000008000003500000036000000820000358000003670000084000036600000374000008600003740000038100000880000382000003880000090000039000000395000009200003980000040200000

Page 15

Solution Manual For Production And Operations Analysis, 6th Edition - Page 15 preview image

Loading page image...

Chapter 01-Strategy and Competition1-1494000040600000409000009600004140000041600000980000422000004230000010000004300000043000000Break-evenquantityis1,000,000

Page 16

Solution Manual For Production And Operations Analysis, 6th Edition - Page 16 preview image

Loading page image...

Chapter 02-Forecasting2-1ForecastingSolutions To Problems From Chapter 22.1TrendSeasonalityCyclesRandomness2.2Cycles have repeating patterns that vary in length and magnitude.2.3a)Time Seriesb)Regression or Causal Modelc)Delphi Method2.4Marketing:New sales and existing sales forecasts. Causal models relating advertisingto salesAccountingInterest rate forecasts; cost components, bad debts.Finance:Changes instock market,forecastreturn on investmentreturn fromspecific projects.Production:Forecastproductdemand(aggregateandindividual),availabilityofresources, labor.2.5a)Aggregate forecasts deal with item groups or families.b)Short term forecasts are generally next day or month; Long term forecasts may be formany months or years into the future.c)Causal models are based on relationship between predictor variables and othervariables. Naive models are based on the past history of series only2.6The Delphi Method is a technique for achieving convergence of group opinion. Themethod has several potential advantages over the Jury of Executive Opinion methoddepending upon how that method is implemented. If the executives are allowed to reach aconsensusasagroup,strongpersonalitiesmaydominate.Iftheexecutivesareinterviewed, the biases of the interviewer could affect the results.
Preview Mode

This document has 469 pages. Sign in to access the full document!

Study Now!

XY-Copilot AI
Unlimited Access
Secure Payment
Instant Access
24/7 Support
Document Chat

Document Details

Related Documents

View all