STAT 3001 Week 2 Project

A project analyzing statistical data with applications in probability and hypothesis testing.

Charlotte Kelly
Contributor
4.4
39
5 months ago
Preview (4 of 10 Pages)
100%
Purchase to unlock

Page 1

STAT 3001 Week 2 Project - Page 1 preview image

Loading page image...

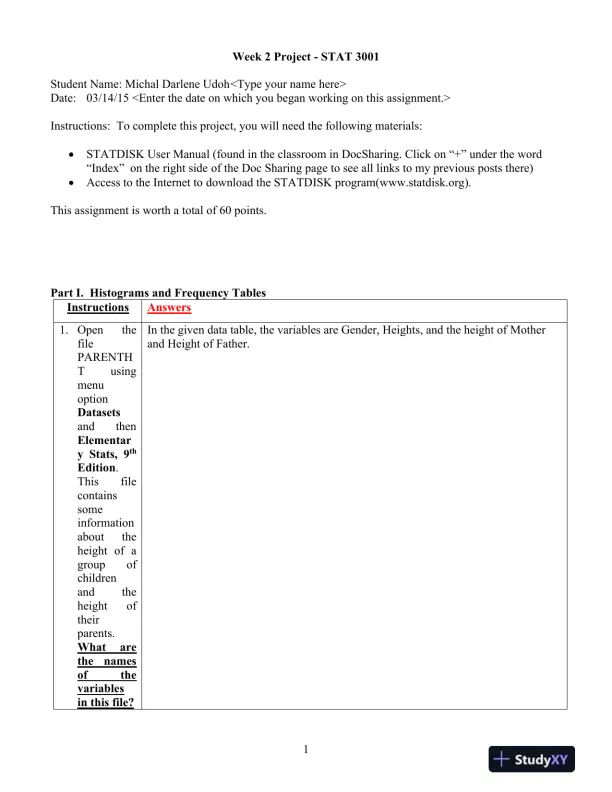
1Week2Project-STAT 3001Student Name:Michal Darlene Udoh<Type your name here>Date:03/14/15<Enter the date on which you began working on this assignment.>Instructions: To complete this project, you will need thefollowing materials:STATDISK User Manual (found in the classroom in DocSharing. Click on “+” under the word“Index” on the right side of the Doc Sharing page to see all links to my previous posts there)Access to the Internet to download the STATDISK program(www.statdisk.org).This assignment is worth a total of 60 points.Part I. Histograms and Frequency TablesInstructionsAnswers1.OpenthefilePARENTHTusingmenuoptionDatasetsandthenElementary Stats, 9thEdition.Thisfilecontainssomeinformationabouttheheight of agroupofchildrenandtheheightoftheirparents.Whatarethenamesofthevariablesin this file?In thegiven data table, the variables are Gender, Heights, and the height ofMotherand Height of Father.

Page 2

STAT 3001 Week 2 Project - Page 2 preview image

Loading page image...

Page 3

STAT 3001 Week 2 Project - Page 3 preview image

Loading page image...

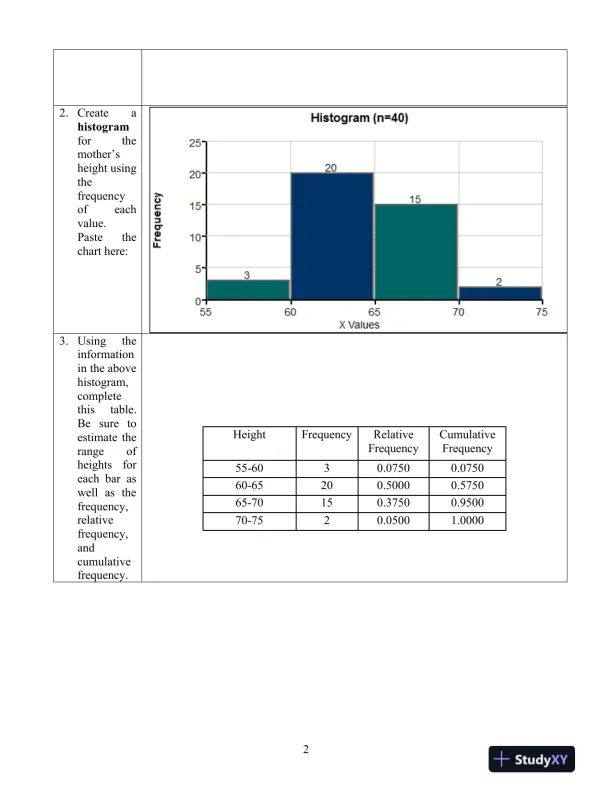
22.Createahistogramforthemother’sheight usingthefrequencyofeachvalue.Pastethechart here:3.Usingtheinformationin the abovehistogram,completethistable.Besuretoestimate therangeofheightsforeach bar aswell as thefrequency,relativefrequency,andcumulativefrequency.HeightFrequencyRelativeFrequencyCumulativeFrequency55-6030.07500.075060-65200.50000.575065-70150.37500.950070-7520.05001.0000

Page 4

STAT 3001 Week 2 Project - Page 4 preview image

Loading page image...

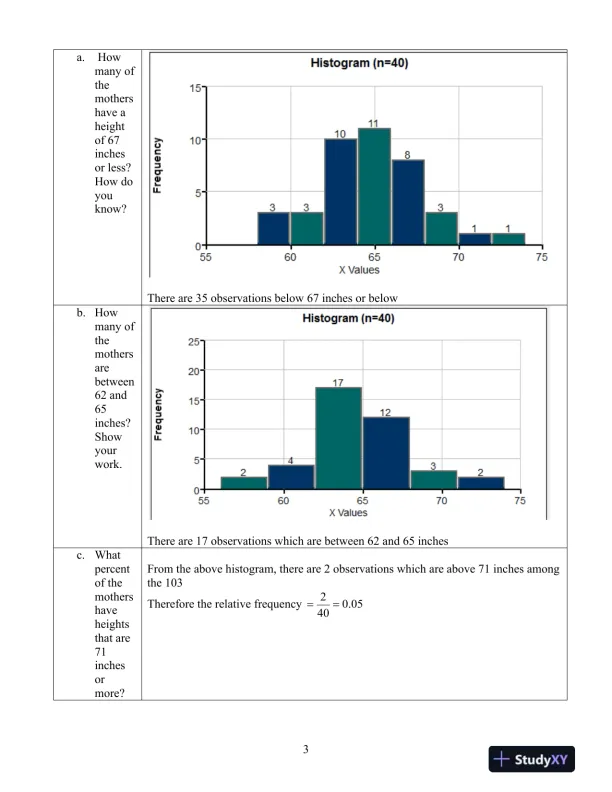
3a.Howmany ofthemothershave aheightof 67inchesor less?How doyouknow?There are 35observations below 67 inches or belowb.Howmany ofthemothersarebetween62 and65inches?Showyourwork.There are 17 observations which are between 62 and 65 inchesc.Whatpercentof themothershaveheightsthat are71inchesormore?From the above histogram, there are 2 observations which are above 71 inches amongthe 103Therefore the relative frequency20.0540
Preview Mode

This document has 10 pages. Sign in to access the full document!

Study Now!

XY-Copilot AI
Unlimited Access
Secure Payment
Instant Access
24/7 Support
Document Chat

Document Details

Related Documents

View all