STAT 3001 Week 3 Project

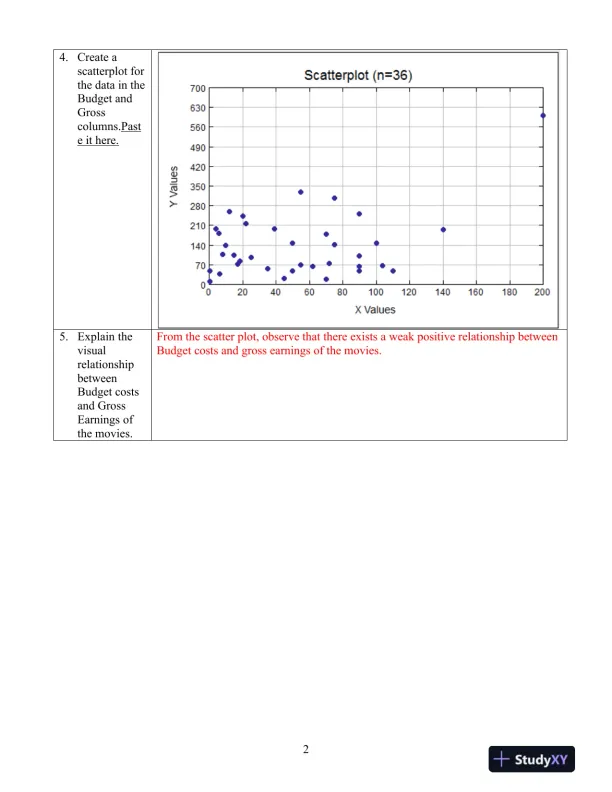
A research project on data interpretation, probability, and statistical distributions.

Chloe Martinez
Contributor
5.0
31
about 1 month ago
Preview (3 of 8)
Sign in to access the full document!
1
Week 3 Project - STAT 3001
Student Name: <Type your name here>
Date: <Enter the date on which you began working on this assignment.>
Instructions: To complete this project, you will need the following materials:
STATDISK User Manual (found in the classroom in DocSharing)
Access to the Internet to download the STATDISK program.
Part I. Analyze Data
Instructions Answers
1. Open the file MOVIES using
menu option Datasets and
then Elementary Stats, 9th
Edition. This file contains
some information about a
collection of movies.How
many observations are
there in this file?
There are 36 movies in the data set
2. Analyze the data in this file
and complete the following
table, indicating for each
variable what type of data it
represents.
Variable Qualitative/
Quantitative
Discrete/
Continuous/
Neither
Level of
Measurement
Rating Qualitative Neither Nominal
Budget Quantitative Discrete Ratio
Gross Quantitative Discrete Ratio
Length Quantitative Discrete Ratio
Viewer Quantitative Discrete Ordinal
3. Would you consider this data
to represent a sample or a
population?
This data represents only sample
Part II. ScatterPlots
2
4. Create a
scatterplot for
the data in the
Budget and
Gross
columns.Past
e it here.
5. Explain the
visual
relationship
between
Budget costs
and Gross
Earnings of
the movies.
From the scatter plot, observe that there exists a weak positive relationship between
Budget costs and gross earnings of the movies.
Preview Mode

Sign in to access the full document!

100%

Study Now!

XY-Copilot AI
Unlimited Access
Secure Payment
Instant Access
24/7 Support
Document Chat

Document Details

University
Walden University
Subject
Statistics

Related Documents

View all