STAT 3001 Week 3 Project Solution Correct Answers

Week 3 project answers for a statistics course.

Chloe Martinez
Contributor
4.3
56
5 months ago
Preview (4 of 12 Pages)
100%
Purchase to unlock

Page 1

STAT 3001 Week 3 Project Solution Correct Answers - Page 1 preview image

Loading page image...

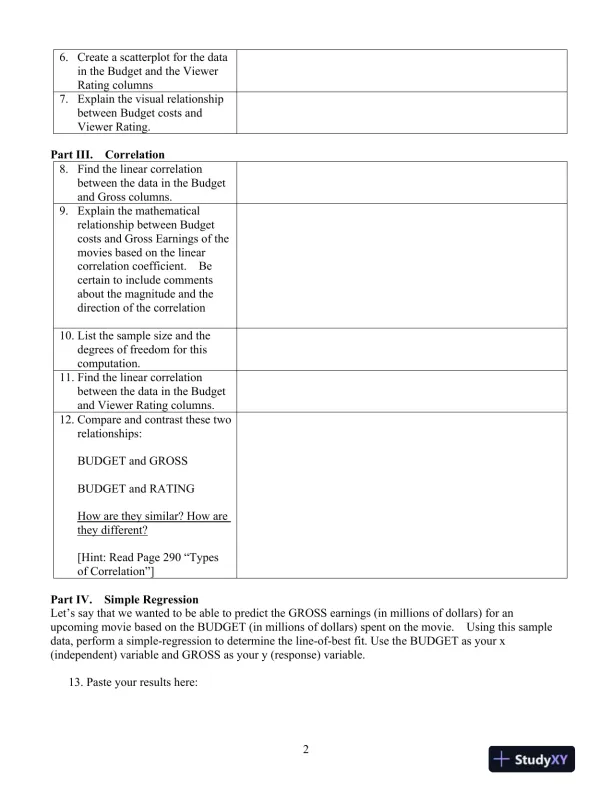
1STAT 3001 Week3ProjectSolution Correct AnswersStudent Name:<Type your name here>Date:<Enter the date on which you began working on this assignment.>Instructions:To complete this project, you will need the following materials:STATDISK User Manual (found in the classroom in DocSharing)Access to the Internet to download the STATDISK program.Part I.Analyze DataInstructionsAnswers1.Open the file MOVIES usingmenu optionDatasetsandthenElementary Stats, 9thEdition.This file containssome information about acollection of movies.Howmany observations arethere in this file?2.Analyze the data in this fileand complete the followingtable, indicating for eachvariable what type of data itrepresents.VariableQualitative/QuantitativeDiscrete/Continuous/NeitherLevel ofMeasurementRatingBudgetGrossLengthViewer3.Would you consider this datato represent a sample or apopulation?Part II. ScatterPlots4.Create a scatterplotforthe datain theBudgetandGrosscolumns.Paste it here.5.Explain the visual relationshipbetweenBudgetcosts andGross Earningsof the movies.

Page 2

STAT 3001 Week 3 Project Solution Correct Answers - Page 2 preview image

Loading page image...

Page 3

STAT 3001 Week 3 Project Solution Correct Answers - Page 3 preview image

Loading page image...

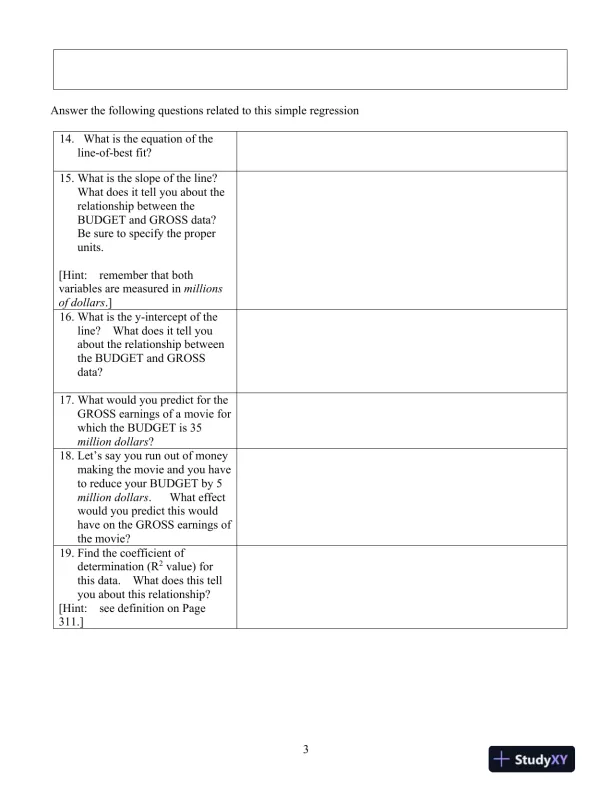
26.Create a scatterplotforthe datain theBudgetand theViewerRatingcolumns7.Explain the visual relationshipbetweenBudgetcosts andViewer Rating.Part III.Correlation8.Find the linear correlationbetween the data in theBudgetandGrosscolumns.9.Explain the mathematicalrelationship betweenBudgetcosts andGross Earningsof themovies based on the linearcorrelation coefficient.Becertain to include commentsabout the magnitude and thedirection of the correlation10.List the sample size and thedegrees of freedom for thiscomputation.11.Find the linear correlationbetween the data in theBudgetand Viewer Ratingcolumns.12.Compare and contrast these tworelationships:BUDGET and GROSSBUDGET and RATINGHow are they similar? How arethey different?[Hint:Read Page 290 “TypesofCorrelation”]PartIV.Simple RegressionLet’s say that we wanted to be able to predict the GROSS earnings (in millions of dollars) for anupcoming movie based on the BUDGET (in millions of dollars) spent on the movie.Using this sampledata, perform a simple-regression to determine the line-of-best fit. Use the BUDGET as your x(independent) variable and GROSS as your y (response) variable.13.Paste your results here:

Page 4

STAT 3001 Week 3 Project Solution Correct Answers - Page 4 preview image

Loading page image...

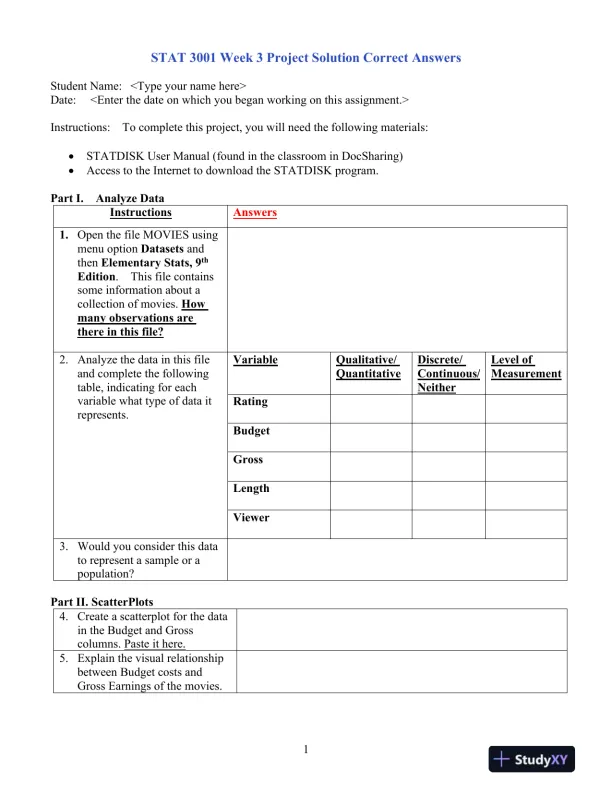
3Answer the following questions related to this simple regression14.What is the equation of theline-of-best fit?15.What is the slope of the line?What does it tell you about therelationship between theBUDGETandGROSSdata?Be sure to specify the properunits.[Hint:remember that bothvariables are measured inmillionsof dollars.]16.What is the y-intercept of theline?What does it tell youabout the relationship betweentheBUDGETandGROSSdata?17.What would you predict for theGROSS earnings of a movie forwhich the BUDGET is 35million dollars?18.Let’s say you run out of moneymaking the movie and you haveto reduce your BUDGET by 5million dollars.What effectwould you predict this wouldhave on the GROSS earnings ofthe movie?19.Findthecoefficient ofdetermination(R2value) forthis data.What does this tellyou about this relationship?[Hint:see definition on Page311.]
Preview Mode

This document has 12 pages. Sign in to access the full document!

Study Now!

XY-Copilot AI
Unlimited Access
Secure Payment
Instant Access
24/7 Support
Document Chat

Document Details

Related Documents

View all