Class Notes For Operations Management: Processes and Supply Chains, 11th Edition
Class Notes For Operations Management: Processes and Supply Chains, 11th Edition simplifies complex topics with easy-to-understand notes.
Alexander Wilson
Contributor
4.8
45
about 2 months ago
Preview (31 of 229)
Sign in to access the full document!
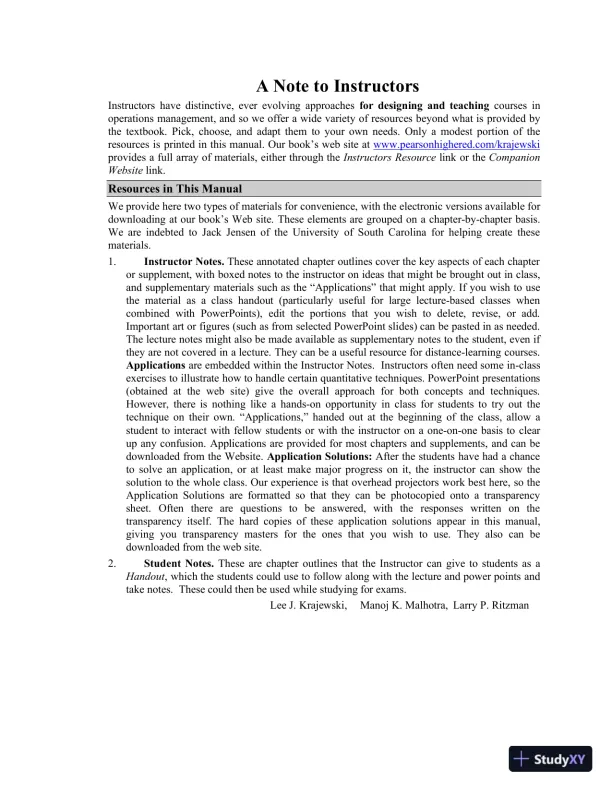
A Note to Instructors
Instructors have distinctive, ever evolving approaches for designing and teaching courses in
operations management, and so we offer a wide variety of resources beyond what is provided by
the textbook. Pick, choose, and adapt them to your own needs. Only a modest portion of the
resources is printed in this manual. Our book’s web site at www.pearsonhighered.com/krajewski
provides a full array of materials, either through the Instructors Resource link or the Companion
Website link.
Resources in This Manual
We provide here two types of materials for convenience, with the electronic versions available for
downloading at our book’s Web site. These elements are grouped on a chapter-by-chapter basis.
We are indebted to Jack Jensen of the University of South Carolina for helping create these
materials.
1. Instructor Notes. These annotated chapter outlines cover the key aspects of each chapter
or supplement, with boxed notes to the instructor on ideas that might be brought out in class,
and supplementary materials such as the “Applications” that might apply. If you wish to use
the material as a class handout (particularly useful for large lecture-based classes when
combined with PowerPoints), edit the portions that you wish to delete, revise, or add.
Important art or figures (such as from selected PowerPoint slides) can be pasted in as needed.
The lecture notes might also be made available as supplementary notes to the student, even if
they are not covered in a lecture. They can be a useful resource for distance-learning courses.
Applications are embedded within the Instructor Notes. Instructors often need some in-class
exercises to illustrate how to handle certain quantitative techniques. PowerPoint presentations
(obtained at the web site) give the overall approach for both concepts and techniques.
However, there is nothing like a hands-on opportunity in class for students to try out the
technique on their own. “Applications,” handed out at the beginning of the class, allow a
student to interact with fellow students or with the instructor on a one-on-one basis to clear
up any confusion. Applications are provided for most chapters and supplements, and can be
downloaded from the Website. Application Solutions: After the students have had a chance
to solve an application, or at least make major progress on it, the instructor can show the
solution to the whole class. Our experience is that overhead projectors work best here, so the
Application Solutions are formatted so that they can be photocopied onto a transparency
sheet. Often there are questions to be answered, with the responses written on the
transparency itself. The hard copies of these application solutions appear in this manual,
giving you transparency masters for the ones that you wish to use. They also can be
downloaded from the web site.
2. Student Notes. These are chapter outlines that the Instructor can give to students as a
Handout, which the students could use to follow along with the lecture and power points and
take notes. These could then be used while studying for exams.
Lee J. Krajewski, Manoj K. Malhotra, Larry P. Ritzman
Chapter
1 Using Operations To Create Value
Course Introduction
1. Today’s objectives:
a. What are the course requirements?
b. What is OM? OM deals with processes that produce services and goods that people use
every day.
TEACHING TIP
Ask the students to share their ideas on a business they would like to start. Discuss the major
OM, Accounting, Finance, Human Resources, Management Information Systems, and Marketing
decisions.
c. Why study OM?
2. Course objectives:
a. Primary goal of this textbook is to gain an understanding of how to make operations a
competitive weapon
b. Strategy and analysis
3. Syllabus
a. Go over course outline
b. Performance measures
c. Office hours and other administration
d. Questions
e. Nature of assignments
TEACHING TIP
Introduce with Disney. The operational planning at Disney provides one example of designing
processes for competitive operations.
1. Operations management deals with the systematic design, direction, and control of processes.
a. “A process is an activity or group of activities that takes one or more inputs, transforms
them, and provides one or more outputs for its customers.”
b. An “Operation is a group of resources performing all or part of one or more processes.”
c. “Supply chain management is the synchronization of a firm’s processes with those of
its suppliers and customers to match flow of materials, services, and information with
customer demand.”
1. Role of Operations in an Organization
1. Operations serve as an excellent career path to upper management positions in many
organizations because operations managers are responsible for key decisions that affect the
success of the organization.
2. Operations is one of several functions within an organization
a. Cross-functional coordination is essential to effective management
b. Operations plays an important role in meeting global competition
3. Historical Evolution and Perspectives
a. James Watt invented the steam engine in 1785.
b. With the invention of the cotton gin in 1794, Eli Whitney introduced the concept of inter-
changeable parts.
c. The foundations of modern manufacturing and technological breakthroughs were also
inspired by the creation of a mechanical computer by Charles Babbage in the early part of
the nineteenth century.
d. Scientific management of operations and supply chain management was further improved
upon by Frederick Taylor in 1911
e. First is the invention of the assembly line for the Model T car by Henry Ford in 1909
f. Alfred Sloan in the 1930s introduced the idea of strategic planning for achieving product
proliferation and variety
g. Toyota Production System in 1978, Taiichi Ohno laid the groundwork for removing
wasteful activities from an organization.
h. The 1980s were characterized by wide availability of computer aided design (CAD),
computer aided manufacturing (CAM), and automation.
2. Process View
Departments within an organization typically have their own set of objectives and a set of
resources with capabilities to meet those objectives. The concept of a process is much broader: a
process can have its own set of objectives where the work flow may cross different department
boundaries, and require resources from several departments.
1. Any process has inputs and outputs
a. Inputs can include a combination of human resources (workers and managers), capital
(equipment and facilities), purchased materials and services, land, and energy.
b. Processes provide outputs to customers. Outputs could be services (that can take the form
of information) or a tangible product.
c. Customer-supplier relationships
Every process and every person within an organization has customers
External customers
Internal customers
Every process and every person in an organization also relies on suppliers
Loading page 4...
External suppliers
Internal suppliers
d. Inputs and outputs vary, depending on the service or product (examples)
Jewelry store
Inputs: merchandise, the store building, registers, the jeweler, and customers
Outputs: to the external customers are services and sold merchandise
Factory manufacturing blue jeans
Inputs: denim, machines, the plant, workers, managers, and services by outside
consultants
Outputs: clothing and supporting services
2. Nested processes
a. Process within a process
b. Interconnectivity within a business
c. Nature of each process’s inputs and outputs
d. Greater detail in Chapter 4 “Process Analysis”
3. Service and Manufacturing Processes
a. Ratio of services to manufacturing jobs
b. Differences
Nature of output
Degree of customer contact
c. Similarities
Customers expect good service and good products
3. A Supply Chain View
The strategic view is that processes must add value for customers throughout the supply chain;
reinforcing the link between processes and performance. This includes a firm’s internal processes
with those of external customers and suppliers.
1. Core processes
a. Supplier relationship process
b. New service/product development process
c. Order fulfillment process
d. Customer relationship process
2. Support processes
a. provide vital resources and inputs to the core processes
b. capabilities
c. other inputs that allow core processes to function
Loading page 5...
3. Supply Chain Processes
a. Adding value with process innovation in supply chains
Outsourcing
Warehousing
Sourcing
Customer Service
Logistics
Cross-docking
4. Operations Strategy
1. Operations strategy
a. Specifies the means by which operations implements corporate strategy and helps to
build a customer-driven firm.
b. It links long-term and short-term operations decisions to corporate strategy and develops
the capabilities the firm needs to be competitive.
2. Corporate strategy
a. Environmental scanning
b. Developing core competencies
Workforce
Facilities
Market and financial know-how
Systems and technology
c. Developing core processes
d. Developing global strategies
Strategic alliance
Locating abroad.
3. Market analysis
a. Market segmentation
b. Needs assessment
Service or Product Needs. Attributes of the service or product, such as price, quality,
and degree of customization.
Delivery System Needs. Attributes of the processes and the supporting systems, and
resources needed to deliver the service or product, such as availability, convenience,
courtesy, safety, accuracy, reliability, delivery speed, and delivery dependability.
Volume Needs. Attributes of the demand for the service or product, such as high or
low volume, degree of variability in volume, and degree of predictability in volume.
Loading page 6...
Other Needs. Other attributes, such as reputation and number of years in business,
after-sale technical support, ability to invest in international financial markets, and
competent legal services.
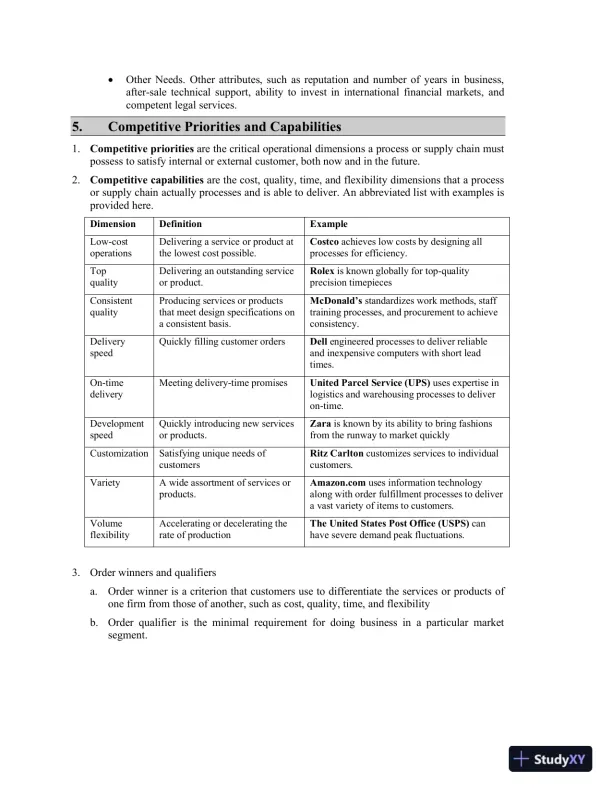
5. Competitive Priorities and Capabilities
1. Competitive priorities are the critical operational dimensions a process or supply chain must
possess to satisfy internal or external customer, both now and in the future.
2. Competitive capabilities are the cost, quality, time, and flexibility dimensions that a process
or supply chain actually processes and is able to deliver. An abbreviated list with examples is
provided here.
Dimension Definition Example
Low-cost
operations
Delivering a service or product at
the lowest cost possible.
Costco achieves low costs by designing all
processes for efficiency.
Top
quality
Delivering an outstanding service
or product.
Rolex is known globally for top-quality
precision timepieces
Consistent
quality
Producing services or products
that meet design specifications on
a consistent basis.
McDonald’s standardizes work methods, staff
training processes, and procurement to achieve
consistency.
Delivery
speed
Quickly filling customer orders Dell engineered processes to deliver reliable
and inexpensive computers with short lead
times.
On-time
delivery
Meeting delivery-time promises United Parcel Service (UPS) uses expertise in
logistics and warehousing processes to deliver
on-time.
Development
speed
Quickly introducing new services
or products.
Zara is known by its ability to bring fashions
from the runway to market quickly
Customization Satisfying unique needs of
customers
Ritz Carlton customizes services to individual
customers.
Variety A wide assortment of services or
products.
Amazon.com uses information technology
along with order fulfillment processes to deliver
a vast variety of items to customers.
Volume
flexibility
Accelerating or decelerating the
rate of production
The United States Post Office (USPS) can
have severe demand peak fluctuations.
3. Order winners and qualifiers
a. Order winner is a criterion that customers use to differentiate the services or products of
one firm from those of another, such as cost, quality, time, and flexibility
b. Order qualifier is the minimal requirement for doing business in a particular market
segment.
Loading page 7...
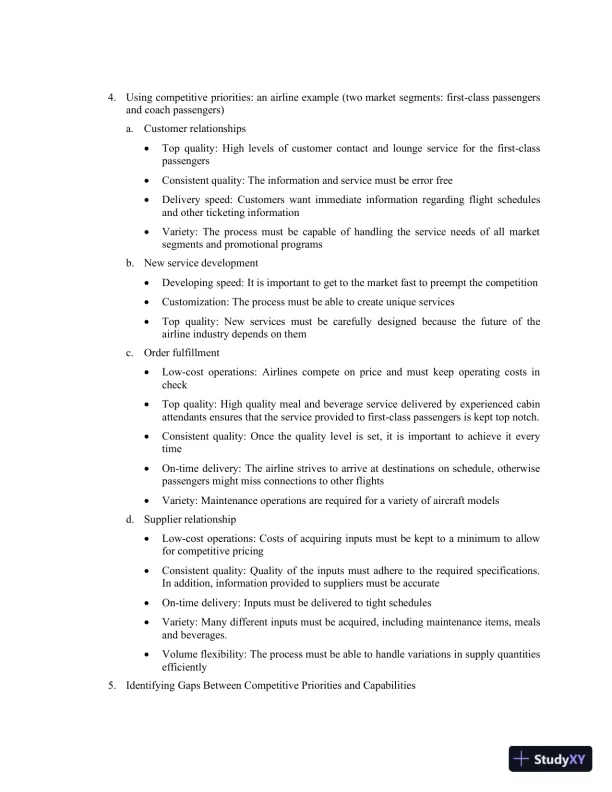
4. Using competitive priorities: an airline example (two market segments: first-class passengers
and coach passengers)
a. Customer relationships
Top quality: High levels of customer contact and lounge service for the first-class
passengers
Consistent quality: The information and service must be error free
Delivery speed: Customers want immediate information regarding flight schedules
and other ticketing information
Variety: The process must be capable of handling the service needs of all market
segments and promotional programs
b. New service development
Developing speed: It is important to get to the market fast to preempt the competition
Customization: The process must be able to create unique services
Top quality: New services must be carefully designed because the future of the
airline industry depends on them
c. Order fulfillment
Low-cost operations: Airlines compete on price and must keep operating costs in
check
Top quality: High quality meal and beverage service delivered by experienced cabin
attendants ensures that the service provided to first-class passengers is kept top notch.
Consistent quality: Once the quality level is set, it is important to achieve it every
time
On-time delivery: The airline strives to arrive at destinations on schedule, otherwise
passengers might miss connections to other flights
Variety: Maintenance operations are required for a variety of aircraft models
d. Supplier relationship
Low-cost operations: Costs of acquiring inputs must be kept to a minimum to allow
for competitive pricing
Consistent quality: Quality of the inputs must adhere to the required specifications.
In addition, information provided to suppliers must be accurate
On-time delivery: Inputs must be delivered to tight schedules
Variety: Many different inputs must be acquired, including maintenance items, meals
and beverages.
Volume flexibility: The process must be able to handle variations in supply quantities
efficiently
5. Identifying Gaps Between Competitive Priorities and Capabilities
Loading page 8...
a. Operations strategy translates service or product plans and competitive priorities for each
market segment into decisions affecting the supply chains that support those market
segments.
b. Once managers determine the competitive priorities for a process, it is necessary to assess
the competitive capabilities of the process.
6. Addressing the Trends and Challenges in Operations Management
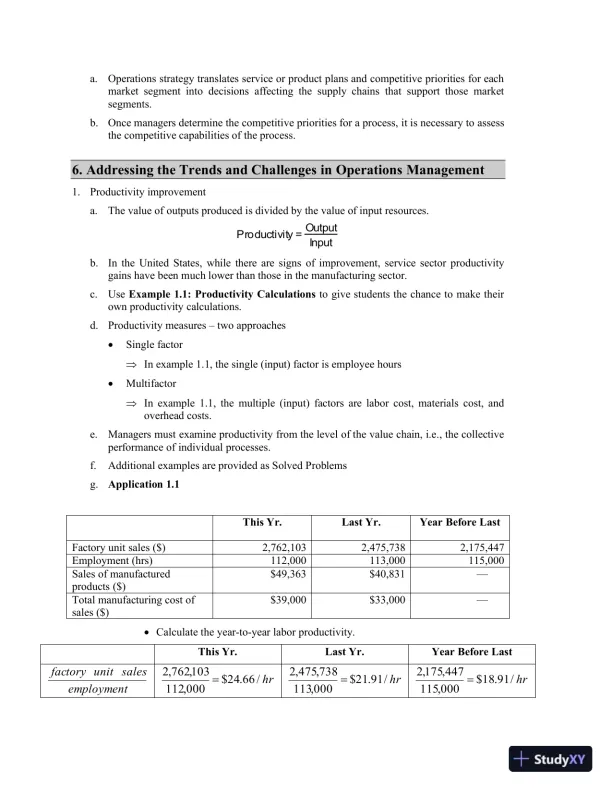
1. Productivity improvement
a. The value of outputs produced is divided by the value of input resources.
Productivity = Output
Input
b. In the United States, while there are signs of improvement, service sector productivity
gains have been much lower than those in the manufacturing sector.
c. Use Example 1.1: Productivity Calculations to give students the chance to make their
own productivity calculations.
d. Productivity measures – two approaches
Single factor
In example 1.1, the single (input) factor is employee hours
Multifactor
In example 1.1, the multiple (input) factors are labor cost, materials cost, and
overhead costs.
e. Managers must examine productivity from the level of the value chain, i.e., the collective
performance of individual processes.
f. Additional examples are provided as Solved Problems
g. Application 1.1
This Yr. Last Yr. Year Before Last
Factory unit sales ($) 2,762,103 2,475,738 2,175,447
Employment (hrs) 112,000 113,000 115,000
Sales of manufactured
products ($)
$49,363 $40,831 —
Total manufacturing cost of
sales ($)
$39,000 $33,000 —
Calculate the year-to-year labor productivity.
This Yr. Last Yr. Year Before Last
employment
salesunitfactory hr/66.24$
000,112
103,762,2 hr/91.21$
000,113
738,475,2 hr/91.18$
000,115
447,175,2
Loading page 9...
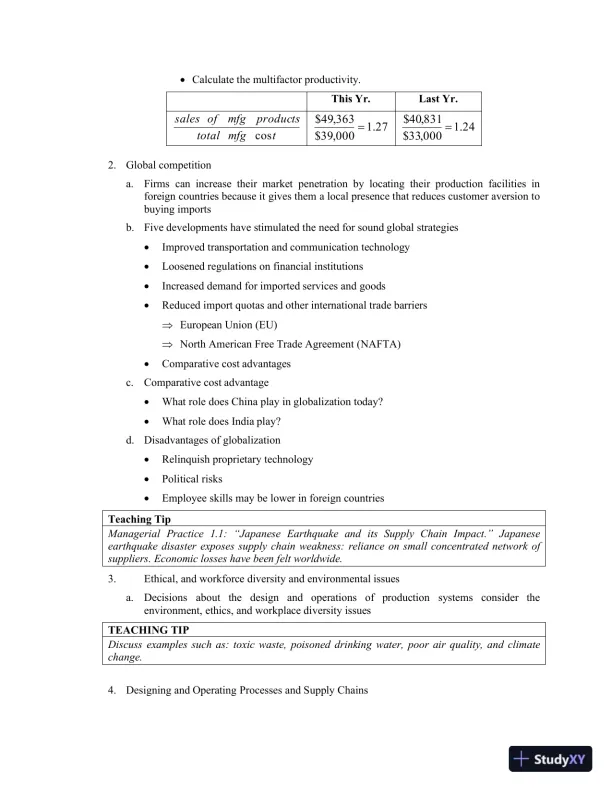
Calculate the multifactor productivity.
This Yr. Last Yr.
tmfgtotal
productsmfgofsales
cos 27.1
000,39$
363,49$ 24.1
000,33$
831,40$
2. Global competition
a. Firms can increase their market penetration by locating their production facilities in
foreign countries because it gives them a local presence that reduces customer aversion to
buying imports
b. Five developments have stimulated the need for sound global strategies
Improved transportation and communication technology
Loosened regulations on financial institutions
Increased demand for imported services and goods
Reduced import quotas and other international trade barriers
European Union (EU)
North American Free Trade Agreement (NAFTA)
Comparative cost advantages
c. Comparative cost advantage
What role does China play in globalization today?
What role does India play?
d. Disadvantages of globalization
Relinquish proprietary technology
Political risks
Employee skills may be lower in foreign countries
Teaching Tip
Managerial Practice 1.1: “Japanese Earthquake and its Supply Chain Impact.” Japanese
earthquake disaster exposes supply chain weakness: reliance on small concentrated network of
suppliers. Economic losses have been felt worldwide.
3. Ethical, and workforce diversity and environmental issues
a. Decisions about the design and operations of production systems consider the
environment, ethics, and workplace diversity issues
TEACHING TIP
Discuss examples such as: toxic waste, poisoned drinking water, poor air quality, and climate
change.
4. Designing and Operating Processes and Supply Chains
Loading page 10...
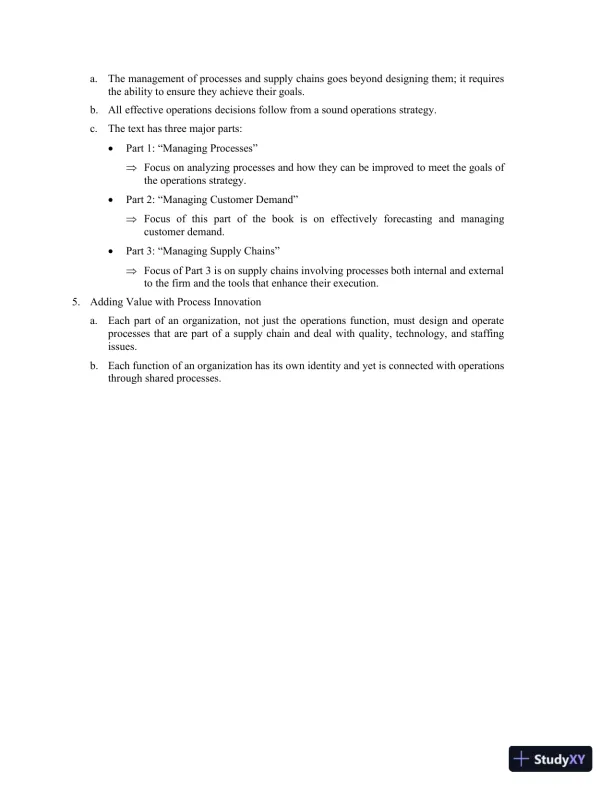
a. The management of processes and supply chains goes beyond designing them; it requires
the ability to ensure they achieve their goals.
b. All effective operations decisions follow from a sound operations strategy.
c. The text has three major parts:
Part 1: “Managing Processes”
Focus on analyzing processes and how they can be improved to meet the goals of
the operations strategy.
Part 2: “Managing Customer Demand”
Focus of this part of the book is on effectively forecasting and managing
customer demand.
Part 3: “Managing Supply Chains”
Focus of Part 3 is on supply chains involving processes both internal and external
to the firm and the tools that enhance their execution.
5. Adding Value with Process Innovation
a. Each part of an organization, not just the operations function, must design and operate
processes that are part of a supply chain and deal with quality, technology, and staffing
issues.
b. Each function of an organization has its own identity and yet is connected with operations
through shared processes.
Loading page 11...
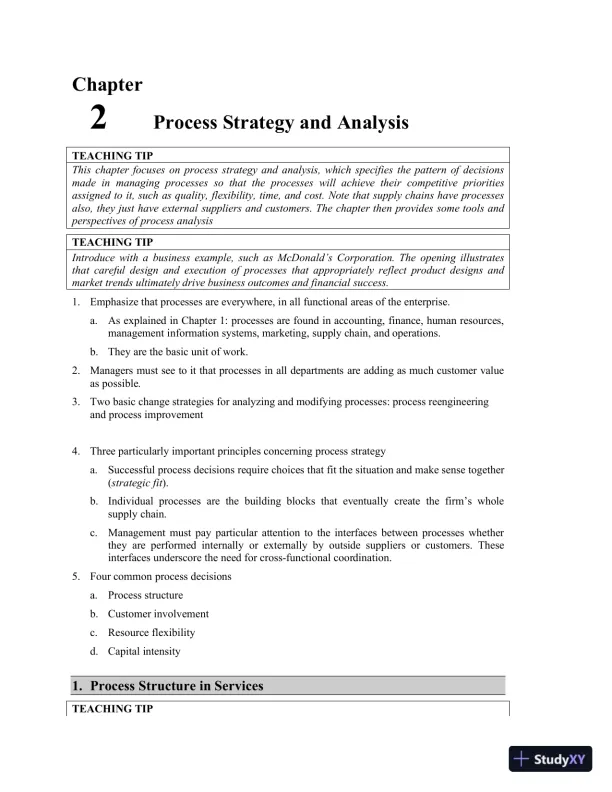
Chapter
2 Process Strategy and Analysis
TEACHING TIP
This chapter focuses on process strategy and analysis, which specifies the pattern of decisions
made in managing processes so that the processes will achieve their competitive priorities
assigned to it, such as quality, flexibility, time, and cost. Note that supply chains have processes
also, they just have external suppliers and customers. The chapter then provides some tools and
perspectives of process analysis
TEACHING TIP
Introduce with a business example, such as McDonald’s Corporation. The opening illustrates
that careful design and execution of processes that appropriately reflect product designs and
market trends ultimately drive business outcomes and financial success.
1. Emphasize that processes are everywhere, in all functional areas of the enterprise.
a. As explained in Chapter 1: processes are found in accounting, finance, human resources,
management information systems, marketing, supply chain, and operations.
b. They are the basic unit of work.
2. Managers must see to it that processes in all departments are adding as much customer value
as possible.
3. Two basic change strategies for analyzing and modifying processes: process reengineering
and process improvement
4. Three particularly important principles concerning process strategy
a. Successful process decisions require choices that fit the situation and make sense together
(strategic fit).
b. Individual processes are the building blocks that eventually create the firm’s whole
supply chain.
c. Management must pay particular attention to the interfaces between processes whether
they are performed internally or externally by outside suppliers or customers. These
interfaces underscore the need for cross-functional coordination.
5. Four common process decisions
a. Process structure
b. Customer involvement
c. Resource flexibility
d. Capital intensity
1. Process Structure in Services
TEACHING TIP
Loading page 12...
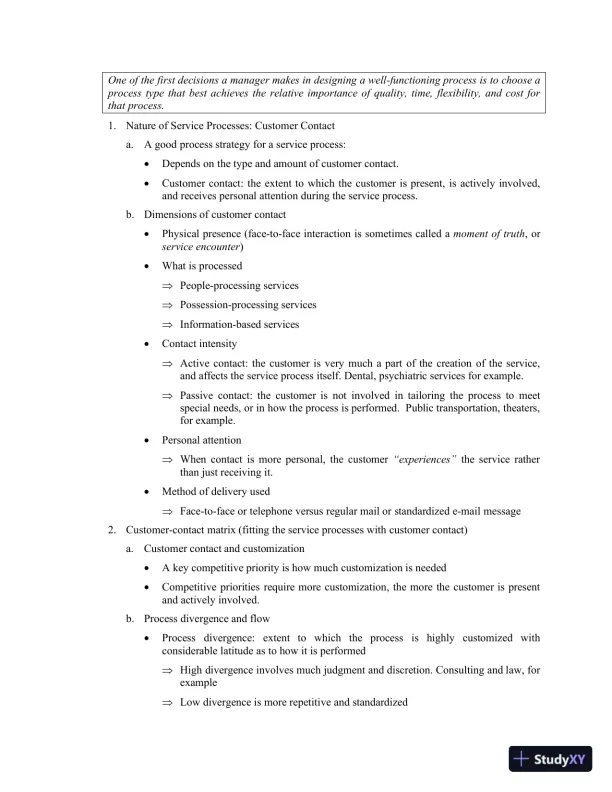
One of the first decisions a manager makes in designing a well-functioning process is to choose a
process type that best achieves the relative importance of quality, time, flexibility, and cost for
that process.
1. Nature of Service Processes: Customer Contact
a. A good process strategy for a service process:
Depends on the type and amount of customer contact.
Customer contact: the extent to which the customer is present, is actively involved,
and receives personal attention during the service process.
b. Dimensions of customer contact
Physical presence (face-to-face interaction is sometimes called a moment of truth, or
service encounter)
What is processed
People-processing services
Possession-processing services
Information-based services
Contact intensity
Active contact: the customer is very much a part of the creation of the service,
and affects the service process itself. Dental, psychiatric services for example.
Passive contact: the customer is not involved in tailoring the process to meet
special needs, or in how the process is performed. Public transportation, theaters,
for example.
Personal attention
When contact is more personal, the customer “experiences” the service rather
than just receiving it.
Method of delivery used
Face-to-face or telephone versus regular mail or standardized e-mail message
2. Customer-contact matrix (fitting the service processes with customer contact)
a. Customer contact and customization
A key competitive priority is how much customization is needed
Competitive priorities require more customization, the more the customer is present
and actively involved.
b. Process divergence and flow
Process divergence: extent to which the process is highly customized with
considerable latitude as to how it is performed
High divergence involves much judgment and discretion. Consulting and law, for
example
Low divergence is more repetitive and standardized
Loading page 13...
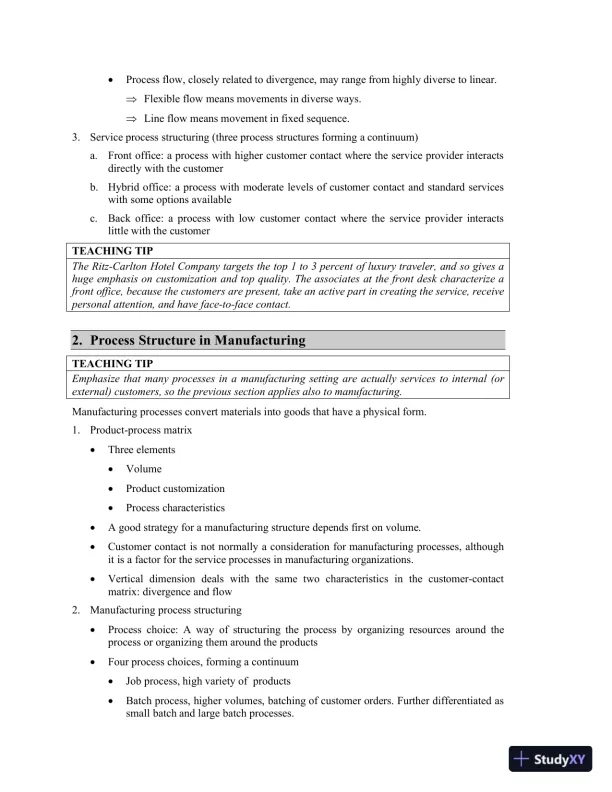
Process flow, closely related to divergence, may range from highly diverse to linear.
Flexible flow means movements in diverse ways.
Line flow means movement in fixed sequence.
3. Service process structuring (three process structures forming a continuum)
a. Front office: a process with higher customer contact where the service provider interacts
directly with the customer
b. Hybrid office: a process with moderate levels of customer contact and standard services
with some options available
c. Back office: a process with low customer contact where the service provider interacts
little with the customer
TEACHING TIP
The Ritz-Carlton Hotel Company targets the top 1 to 3 percent of luxury traveler, and so gives a
huge emphasis on customization and top quality. The associates at the front desk characterize a
front office, because the customers are present, take an active part in creating the service, receive
personal attention, and have face-to-face contact.
2. Process Structure in Manufacturing
TEACHING TIP
Emphasize that many processes in a manufacturing setting are actually services to internal (or
external) customers, so the previous section applies also to manufacturing.
Manufacturing processes convert materials into goods that have a physical form.
1. Product-process matrix
Three elements
Volume
Product customization
Process characteristics
A good strategy for a manufacturing structure depends first on volume.
Customer contact is not normally a consideration for manufacturing processes, although
it is a factor for the service processes in manufacturing organizations.
Vertical dimension deals with the same two characteristics in the customer-contact
matrix: divergence and flow
2. Manufacturing process structuring
Process choice: A way of structuring the process by organizing resources around the
process or organizing them around the products
Four process choices, forming a continuum
Job process, high variety of products
Batch process, higher volumes, batching of customer orders. Further differentiated as
small batch and large batch processes.
Loading page 14...
Line process, high-volumes, standardized products, dedicated resources, repetitive
manufacturing
Continuous flow process, the extreme end of high-volumes, rigid line flows. Primary
material moves without stopping.
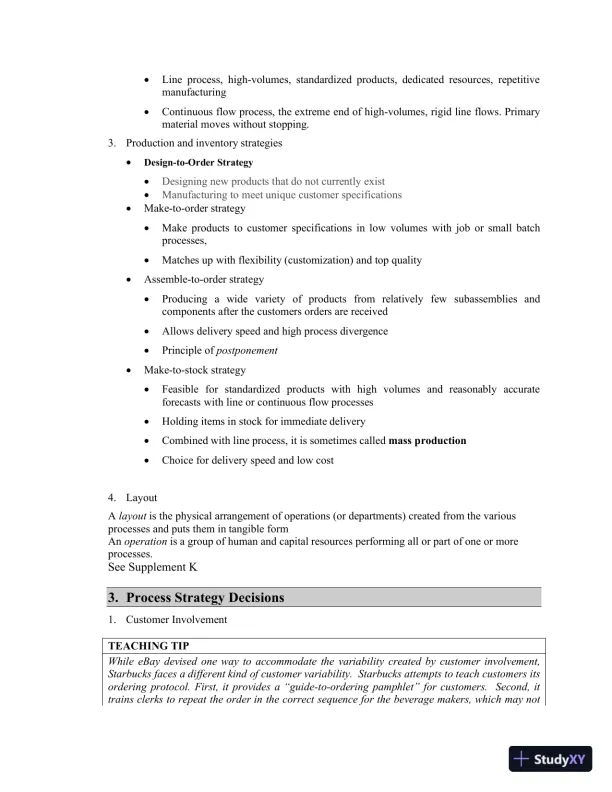
3. Production and inventory strategies
Design-to-Order Strategy
Designing new products that do not currently exist
Manufacturing to meet unique customer specifications
Make-to-order strategy
Make products to customer specifications in low volumes with job or small batch
processes,
Matches up with flexibility (customization) and top quality
Assemble-to-order strategy
Producing a wide variety of products from relatively few subassemblies and
components after the customers orders are received
Allows delivery speed and high process divergence
Principle of postponement
Make-to-stock strategy
Feasible for standardized products with high volumes and reasonably accurate
forecasts with line or continuous flow processes
Holding items in stock for immediate delivery
Combined with line process, it is sometimes called mass production
Choice for delivery speed and low cost
4. Layout
A layout is the physical arrangement of operations (or departments) created from the various
processes and puts them in tangible form
An operation is a group of human and capital resources performing all or part of one or more
processes.
See Supplement K
3. Process Strategy Decisions
1. Customer Involvement
TEACHING TIP
While eBay devised one way to accommodate the variability created by customer involvement,
Starbucks faces a different kind of customer variability. Starbucks attempts to teach customers its
ordering protocol. First, it provides a “guide-to-ordering pamphlet” for customers. Second, it
trains clerks to repeat the order in the correct sequence for the beverage makers, which may not
Loading page 15...
be how the customer presented it. This process not only makes it easier for the beverage makers,
but also indirectly “trains” the customer in how to place their orders.
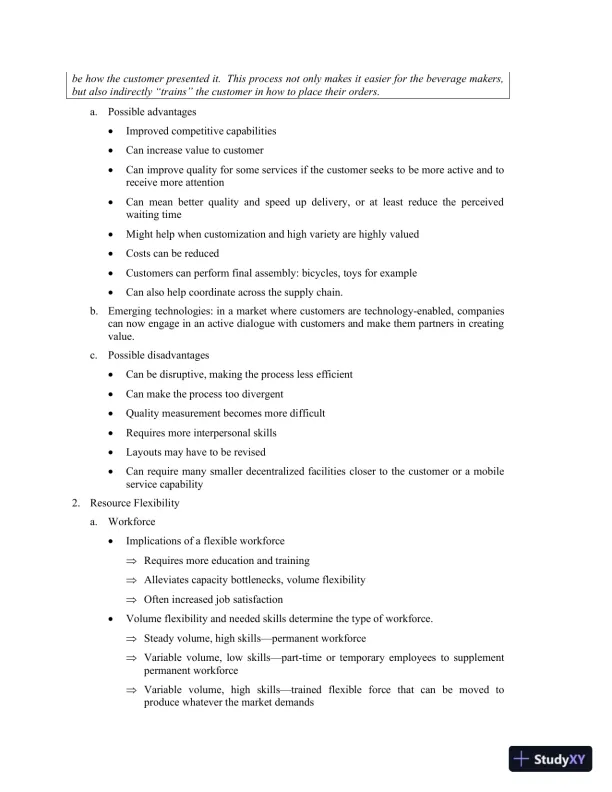
a. Possible advantages
Improved competitive capabilities
Can increase value to customer
Can improve quality for some services if the customer seeks to be more active and to
receive more attention
Can mean better quality and speed up delivery, or at least reduce the perceived
waiting time
Might help when customization and high variety are highly valued
Costs can be reduced
Customers can perform final assembly: bicycles, toys for example
Can also help coordinate across the supply chain.
b. Emerging technologies: in a market where customers are technology-enabled, companies
can now engage in an active dialogue with customers and make them partners in creating
value.
c. Possible disadvantages
Can be disruptive, making the process less efficient
Can make the process too divergent
Quality measurement becomes more difficult
Requires more interpersonal skills
Layouts may have to be revised
Can require many smaller decentralized facilities closer to the customer or a mobile
service capability
2. Resource Flexibility
a. Workforce
Implications of a flexible workforce
Requires more education and training
Alleviates capacity bottlenecks, volume flexibility
Often increased job satisfaction
Volume flexibility and needed skills determine the type of workforce.
Steady volume, high skills—permanent workforce
Variable volume, low skills—part-time or temporary employees to supplement
permanent workforce
Variable volume, high skills—trained flexible force that can be moved to
produce whatever the market demands
Loading page 16...
b. Equipment
Managers must account for process divergence and diverse process flows when
making resource flexibility decisions. Break-even analysis can be useful.
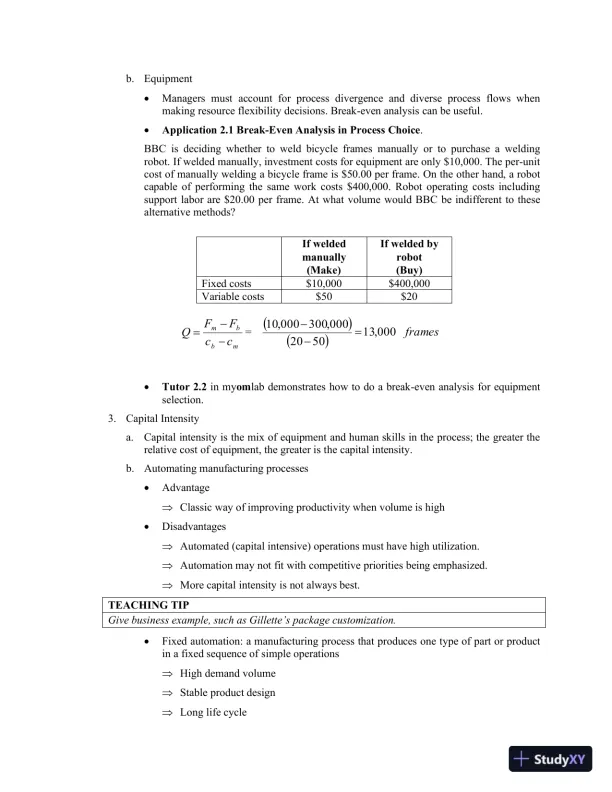
Application 2.1 Break-Even Analysis in Process Choice.
BBC is deciding whether to weld bicycle frames manually or to purchase a welding
robot. If welded manually, investment costs for equipment are only $10,000. The per-unit
cost of manually welding a bicycle frame is $50.00 per frame. On the other hand, a robot
capable of performing the same work costs $400,000. Robot operating costs including
support labor are $20.00 per frame. At what volume would BBC be indifferent to these
alternative methods?
If welded
manually
(Make)
If welded by
robot
(Buy)
Fixed costs $10,000 $400,000
Variable costs $50 $20
mb
bm
cc
FF
Q
=
frames000,13
5020
000,300000,10
Tutor 2.2 in myomlab demonstrates how to do a break-even analysis for equipment
selection.
3. Capital Intensity
a. Capital intensity is the mix of equipment and human skills in the process; the greater the
relative cost of equipment, the greater is the capital intensity.
b. Automating manufacturing processes
Advantage
Classic way of improving productivity when volume is high
Disadvantages
Automated (capital intensive) operations must have high utilization.
Automation may not fit with competitive priorities being emphasized.
More capital intensity is not always best.
TEACHING TIP
Give business example, such as Gillette’s package customization.
Fixed automation: a manufacturing process that produces one type of part or product
in a fixed sequence of simple operations
High demand volume
Stable product design
Long life cycle
Loading page 17...
TEACHING TIP
Mention chemicals and oil.
Flexible (or programmable) automation: a manufacturing process that can be changed
easily to handle various products.
Useful in both low-customization and high-customization
Can be quickly set up to make a variety of products in small batches
Perhaps show photos of the JustBorn robots
c. Automating service processes
Using capital inputs as a labor-saving device is also possible for service processes.
Examples:
Long-distance learning technology
ATMs
Financial services
Need volume to justify expensive automation, just as in manufacturing
May be front or back office
d. Economies of Scope
Requires a family of products having enough collective volume to utilize equipment fully
Loading page 18...
4. Strategic Fit
The manager process strategist should understand how the four major process decisions tie
together.
1. Decision patterns for service processes
a. Process structure
b. Customer involvement
c. Resource flexibility
d. Capital intensity
2. Decision patterns for manufacturing processes
a. Process structure
b. Customer involvement
c. Resource flexibility
d. Capital intensity
3. Gaining focus
a. Focus by process segments
Plants within plants (PWPs)
b. Focused service operations
c. Focused factories
5. Strategies for Change
1. Process reengineering
TEACHING TIP
Mention Bell Atlantic reengineered its telephone business. After 5 years, it cut the time to
connect new customers from 16-days to just hours.
a. Critical processes
Emphasis is placed on core business processes.
Processes are broadly defined in terms of costs and customer value.
b. Strong leadership
Senior executives must provide a strong leadership for reengineering success
c. Cross-functional teams
Reengineering works best at high-involvement workplaces.
d. Information technology
Primary enabler of process engineering.
e. Clean-slate philosophy
Loading page 19...
Start with the way a customer wants to deal with the company.
f. Process analysis.
Understanding current processes can reveal areas where new thinking will provide
the biggest payoff
2. Process Improvement
a. The systematic study of the activities and flows of each process to improve it.
b. The purpose is to understand the process.
3. Process Analysis
a. The documentation and detailed understanding of how work is performed and how it can
be redesigned
b. Six Sigma Process Improvement Model: employees must be trained in the “whys” and
the “how-tos” of process performance and what it means to customers, both internal and
external
Define: the scope and boundaries of the process to be analyzed are first established.
Measure: once the metrics are identified, it is time to collect information on how the
process is currently performing on each one.
Analyze: use the data on measures to perform process analysis to determine where
improvements are necessary.
Improve: design team generates a long list of ideas for improvements. These ideas
are then sifted and analyzed.
Control: monitor the process to make sure that high performance levels are
maintained.
6. Documenting and Evaluating the Process
TEACHING TIP
Introduce this section with business examples. It could be how processes were improved at
McDonald’s Corporation, which increased customer value with better processes, informed by
innovative data collection.
1. Techniques give management insight on current processes and possible changes.
a. flowcharts
b. work measurement techniques
c. process charts
2. Flowcharts
a. Diagrams that trace the flow of information, customers, equipment, or materials through
the various steps of a process.
b. Flowcharts show how organizations produce their outputs through a myriad of cross
functional work processes, allowing the design team to see all the critical interfaces
between functions and departments.
Loading page 20...
c. Swim Lane Flowcharts
A diagram that groups functional areas responsible for different sub-processes into
lanes.
It is most appropriate when business processes span several departmental boundaries.
d. Service blueprints
A special flowchart of a service process that shows which of its steps has high
customer contact.
Special feature: line of visibility that identifies which steps are visible to the
customer.
TEACHING TIP
A more comprehensive treatment of work measurement techniques is provided in myomlab
Supplement H, “Measuring Output Rates”
Supplement I, “Learning Curve Analysis”
3. Work Measurement techniques
a. Time study method
Selecting the work elements within the process to be studied
Timing the elements
Determining the sampling size
Setting the final standard
b. Elemental standard data approach
Database of standards compiled internally for basic elements
Works well when work elements within a certain jobs are similar to those in other
jobs
Sometimes the time required for a work element depends on variable characteristics
of the jobs
c. Predetermined data approach
Published database that divides each work element even more, into micromotions
d. Work sampling method
Estimates proportion of time spent on different activities
Supplement H, “Measuring Output Rates” in myomlab
e. Learning curve analysis
Takes into account learning that takes place on ongoing basis
Learning curve and concept of doubling
Supplement I, “Learning Curve Analysis” in myomlab
4. Process Charts
a. Concentrates in more detail on a smaller number of steps than does a flowchart.
Loading page 21...
b. It is an organized way of documenting all of the activities performed by a person or a
group of people at a workstation, with a customer, or working with certain materials.
c. Five possible categories
Operation
Transportation
Inspection
Delay
Storage
d. Estimate the annual cost of the entire process.
It becomes a benchmark against which other methods for performing the process can
be evaluated.
Annual labor cost can be estimated by finding the product of
(1) time in hours to perform the process each time
(2) variable costs per hour
(3) number of times the process is performed each year
TEACHING TIP
Mention Video Case: “Process Analysis at Starwood.” If possible, show the video that
accompanies it, using the questions at the end of the written case and the “pause point” in the
video itself to encourage class discussion.
5. Data analysis tools
a. Checklists: a form used to record the frequency of occurrence of certain process failures.
b. Histograms and bar charts
Histogram: summarizes data measured on a continuous scale, showing the frequency
distribution of some process failures.
Bar chart: a series of bars representing the frequency of occurrence of data
characteristics measured on a yes-and-no basis
Use Figure 2.11
c. Pareto Charts: a bar chart on which the factors are plotted in decreasing order of
frequency along the horizontal axis.
Use Example 2.2
d. Scatter diagrams: a plot of two variables showing whether they are related.
e. Cause-and-effect diagram: relates a key performance problem to its potential causes
(sometimes called a fishbone diagram).
Use Example 2.3
f. Graphs: representations of data in a variety of pictorial forms, such as line and pie charts.
Line charts (see the “Quality and Performance” Chapter)
Loading page 22...
Forecasting (see Chapter 8, “Forecasting”)
6. Data snooping
a. The power of the data analysis tools is greatest when they are used together.
b. Data snooping is the use of the tools to sift data, clarify issues and deduce causes.
c. Use Example 2.4
7. Simulation
a. The act of reproducing the behavior of a process using a model that describes each step of
the process.
b. Shows how the process performs dynamically over time.
c. See Supplement E, “Simulation”
7. Redesigning and Managing Process Improvements
1. Generating ideas: questioning and brainstorming
a. A questioning attitude: ask six questions about each step in the process
What is being done?
When is it being done?
Who is doing it?
Where is it being done?
How is it being done?
How well does it do on the various metrics of importance?
TEACHING TIP
For each question, ask why? As time permits, have the class “brainstorm” Solved Problem 2 on
changing auto engine oil. Have students shout out their ideas in rapid fire manner without time
lost just yet for evaluation.
2. Creativity can be stimulated by having a brainstorming session: a time when a group of
people, knowledgeable on the process propose ideas for change by saying whatever comes to
mind
3. Benchmarking: focuses on setting quantitative goals for improvement
a. Competitive benchmarking is based on comparisons with a direct industry competitor.
b. Functional benchmarking compares areas such as administration, customer service, and
sales operations with those of outstanding firms in any industry.
c. Internal benchmarking involves using an organizational unit with superior performance
as the benchmark for other units.
4. Implementing: Seven mistakes to avoid in managing processes:
a. Not connecting with strategic issues
b. Not involving the right people in the right way
Loading page 23...
c. Not giving the design teams and process analysts a clear charter, and then holding
them accountable
d. Not being satisfied unless fundamental “reengineering” changes are made
e. Not considering the impact on people
f. Not giving attention to implementation
g. Not creating an infrastructure for continuous improvement
them accountable
d. Not being satisfied unless fundamental “reengineering” changes are made
e. Not considering the impact on people
f. Not giving attention to implementation
g. Not creating an infrastructure for continuous improvement
Loading page 24...
Chapter
3 Quality and Performance
Process performance and quality should be everyone’s concern.
TEACHING TIP
Introduce with QVC as one example of a company that met the challenge by designing and managing
processes that provide customers with total satisfaction. QVC’s relentless focus on quality and
exceeding customer expectations by placing them at the center of its business processes has paid off
handsomely.
TEACHING TIP
This chapter first addresses the costs of quality and then focuses on Total Quality Management and Six
Sigma, two philosophies and tools that many companies embrace to evaluate and improve quality and
performance. If possible, show the video case “Process Performance and Quality at Starwood Hotel &
Resorts”.
1. Costs of Quality
Any instance when a process fails to satisfy a customer is considered a defect.
Most experts estimate that the cost of quality range from 20 to 30 percent of gross sales.
These costs can be broken down into four major categories.
1. Prevention costs
a. Preventing defects before they happen
b. Redesign the processes to remove causes of poor performance
c. Redesign the service or product to make it simpler, easier to produce
d. Training employees in methods of continuous improvement
e. Working with suppliers to increase quality of purchased items or contracted services
2. Appraisal costs:
a. Costs incurred to identify and assess performance problems
b. As prevention measures improve performance, appraisal costs decrease
3. Internal failure costs
a. Rework—incurred if some aspect of a service or product must be performed again.
b. Scrap—incurred if a defective item is unfit for further processing
TEACHING TIP
Mention an analysis of the viability of acquiring a company that is missing the company’s history of
environmental compliance, or poor paint finish on a car, as examples.
Loading page 25...
4. External failure costs
a. Costs when a defect is discovered after the customer receives the service or product.
b. Warranty service
5. Ethical Failure Costs
a. The societal and monetary costs associated with deceptively passing defective services or
products to internal or external customers such that it jeopardizes the well being of
stockholders, customers, employees, partners, and creditors
b. Deceptive business practice involves three elements:
the conduct of the provider is intentional and motivated by a desire to exploit the customer
the provider conceals the truth based upon what is actually known to the provider
the transaction is intended to generate a disproportionate economic benefit to the provider
at the expense of the customer.
c. Firms that engage in deception, however, undermine the ability and competence of their
employees and demean their relationship with external customers.
d. Ethical behavior falls on the shoulders of all employees of an organization
2. Total Quality Management and Six Sigma
Total quality management (TQM) is a philosophy the stresses three principles for achieving high
levels of process quality and performance.
(1) customer satisfaction
(2) employee involvement
(3) continuous improvement in performance.
TEACHING TIP
TQM also involves a number of important elements covered in this text:
tools and process analysis techniques useful for solving, redesign, and improvement in Chapter 2
“Process Strategy and Analysis ”,Toyota Production System in Chapter6 “Lean Systems” and
Problem-solving tools in Supplement A “Decision Making”
1. Customer satisfaction (internal or external): when customers’ expectations have been met or
exceeded.
a. Conformance to specifications
It is the processes that produced the service or product that are really being judged.
Specifications may relate to consistent quality, on-time delivery, or delivery speed.
b. Value
How well the service or product serves its intended purpose at a price customers are
willing to pay.
c. Fitness for use: customer may consider the convenience of a service or the mechanical
features of a product.
d. Support: the service or product support may be as important to the customer as the
service or product itself.
Loading page 26...
e. Psychological impressions: atmosphere, image, or aesthetics
TEACHING TIP
Mention Managerial Practice 3.1 “Quality at Verizon.” With its focus on quality in operations,
products, services, and technology, it is not surprising that Verizon Wireless has built a great
reputation with its customer base and has also been recognized through several best wireless
service awards.
2. Employee involvement
a. Cultural change
Challenge is to define customer for each employee
External customers buy the service or product.
Internal customers are employees in the firm who rely on output of other employees.
An assembly line is a chain of internal customer-supplier relationships, with an
external customer purchasing the finished goods.
Top management must motivate cultural change.
Everyone is expected to contribute and share the view that quality control is an end to
itself
Quality at the source
b. Teams
Employee involvement is a key tactic for improving processes and quality
Small groups of people
Common purpose.
Set their own performance goals and approaches
Hold themselves accountable for success
Three employee-empowerment approaches to teamwork
Problem-solving teams (also called quality circles)
Special-purpose teams
Self-managing teams, the highest level of worker participation
3. Continuous Improvement
a. Based on the Japanese concept, kaizen
b. The philosophy of continually seeking ways to improve processes.
c. Not unique to quality. Applies to process improvement as well.
Getting started
SPC training
Make SPC a normal aspect of daily operations.
Build work teams and employee involvement.
Utilize problem-solving tools within the work teams.
Loading page 27...
Develop operator ownership in the process.
d. Problem-solving process: The Deming Wheel
Plan—select a process needing improvement, document process, analyze data, set
improvement goals, discuss alternatives, assess benefits and costs, develop a plan and
improvement measures.
Do—implement plan, monitor improvements.
Study—analyze data to evaluate effectiveness of the plan.
Act—document and disseminate improved process as a standard procedure.
4. Six Sigma
a. Relies heavily on the principles of TQM and is a comprehensive and flexible system for
achieving, sustaining, and maximizing business success by minimizing defects and variability
in processes.
b. It is driven by a close understanding of customer needs; the disciplined use of facts, data, and
statistical analysis; and diligent attention to managing, improving, and reinventing business
processes.
TEACHING TIP
Discuss the roles of Motorola and GE.
c. Six Sigma: A comprehensive and flexible system for achieving, sustaining, and maximizing
business success by minimizing defects and variability in processes.
3. Acceptance Sampling
1. The application of statistical techniques to determine if a quality of material should be accepted or
rejected based on the inspection or test of a sample.
2. Acceptable quality level (AQL) is a statement of the proportion of defective items that will be
accepted.
3. In a supply chain, any company can be both a producer of goods purchased by another company
and a consumer of goods or raw materials supplied by another company.
a. The buyer’s specifications for various dimensions of quality become the targets the supplier
shoots for in a supply contract.
b. The supplier’s internal processes must be up to the task; TQM or Six Sigma can help achieve
the desired performance.
c. The buyer’s sampling plan will provide a high probability of accepting AQL (or better).
4. Supplement G, “Acceptance Sampling Plans,” in myomlab shows how to design an acceptance
sampling plan that meets the level of risk desired.
4. Statistical Process Control
TEACHING TIP
Loading page 28...
Relate to tools discussed in Chapter 2: checklists, histograms and bar charts, Pareto charts,
scatter diagrams, cause-and-effect diagrams, and graphs.
Statistical process control (SPC): The application of statistical techniques to determine whether a
process is delivering what a customer wants. Control charts are primarily used to detect defects.
1. Examples of process change that can be detected by SPC
a. A decrease in the average number of complaints per day at a hotel
b. A sudden increase in the proportion of defective gear boxes
c. An increase in the time to process a mortgage application
d. A decline in the number of scrapped units at a milling machine
e. An increase in the number of scrapped units at a milling machine
2. Variation of outputs
a. Performance measurements
Variables — service or product characteristics measured on a continuous scale
Advantage: if defective, we know by how much — the direction and magnitude
of corrections are indicated.
Disadvantage: measurements typically involve special equipment, employee
skills, exacting procedures, and time and effort.
Attributes — a characteristic counted in discrete units, (yes-no, integer number) that
could be quickly counted.
Used to determine conformance to complex specifications, or when measuring
variables is too costly.
Advantages:
Quickly reveals when quality has changed, provides an integer number of
how many are defective.
Requires less effort, and fewer resources than measuring variables.
Disadvantages:
Doesn't show by how much they were defective, the direction and magnitude
of corrections are not indicated.
Requires more observations, since each observation provides little
information.
b. Sampling
Complete inspection
Used when
Costs of failure are high relative to costs of inspection.
Inspection is automated
Sampling plans
Used when
Loading page 29...
Inspection costs are high
Inspection destroys the product
Sampling plans include
Sample size, n random observations
Time between successive samples
Decision rules that determine when action should be taken
c. Sampling distributions
The distribution of sample means can be approximated by the normal distribution
(reference the central limit theorem described in statistics texts).
TEACHING TIP
It is important to distinguish the relationship between the distribution of sample means and the
process distribution itself
sample range
standard deviation
d. Common causes
Random, or unavoidable sources of variation within a process.
TEACHING TIP
Mention, as an example, the time to process specimens at an intensive-care unit lab in a hospital.
Characteristics of distributions
Location—measured by the mean of the distribution
Spread—measured by the range or standard deviation
Shape—whether the observations are symmetrical or skewed
e. Assignable causes
Any cause of variation that can be identified and eliminated.
Change in the mean, spread, or shape of a process distribution is a symptom that an
assignable cause of variation has developed.
After a process is in statistical control, SPC is used to detect significant change,
indicating the need for corrective action.
3. Control charts
a. A control chart has a nominal value, or center line, which can be the process’s historic average
or a target that managers would like the process to achieve.
b. A sample characteristic measured above the upper control limit (UCL) or below the lower
control limit (LCL) indicates that an assignable cause probably exists.
Steps for using a control chart:
Take a random sample, measure the quality characteristic, and calculate a variable or
attribute performance measure.
Loading page 30...
Plot the statistic; if it falls outside the control limits, look for assignable causes.
Eliminate the cause if it degrades performance. Incorporate the cause if it improves
performance. Recalculate the control chart.
Periodically repeat the procedure.
c. Indicators of out of control conditions
A trend in the observations (the process is drifting).
A sudden or step change in the observations.
A run of five or more observations on the same side of the mean (If we flip a coin and get
“heads” five times in a row, we become suspicious of the coin or of the coin flipping
process.)
Several observations near the control limits (Normally only 1 in 20 observations are more
than 2 standard deviations from the mean.)
One or more observations outside of the control limits
d. Two types of error are possible with the use of control charts
Type I
Type II
TEACHING TIP
If possible use Experiential Learning “Statistical Process Control with a Coin Catapult.” Exercise A:
Control Charts for Variables. Exercise B: Control Charts for Attributes
4. Control charts for variables used to monitor the mean and the variability of the process
distribution.
a. R-Charts (also known as range charts)
Monitor process variability
First remove assignable causes of variation.
While process is in statistical control, collect data to estimate the average range of
output that occurs.
To establish the upper and lower control limits for the R-chart, we use Table 3.1,
which provides two factors; D3 and D4. These factors establish the UCLR and LCLR
at three standard deviations above and below R .
RDLCL
RDUCL
R
R
3
4
Loading page 31...
30 more pages available. Scroll down to load them.
Preview Mode
Sign in to access the full document!
100%
Study Now!
XY-Copilot AI
Unlimited Access
Secure Payment
Instant Access
24/7 Support
AI Assistant
Document Details
Subject
Economics