Solution Manual for Statistics for Business and Economics, 11th Edition

Solution Manual for Statistics for Business and Economics, 11th Edition helps you reinforce learning with in-depth, accurate solutions.

Sarah Anderson
Contributor
4.7
147
9 months ago
Preview (31 of 686 Pages)
100%
Purchase to unlock

Page 1

Solution Manual for Statistics for Business and Economics, 11th Edition - Page 1 preview image

Loading page image...

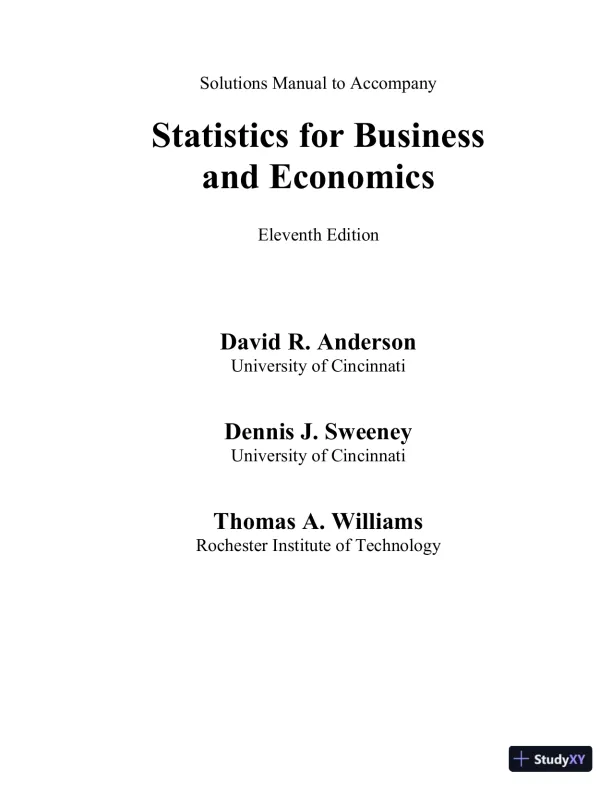
Solutions Manual to AccompanyStatistics for Businessand EconomicsEleventhEditionDavid R. AndersonUniversity of CincinnatiDennis J. SweeneyUniversity of CincinnatiThomas A. WilliamsRochester Institute of Technology

Page 2

Solution Manual for Statistics for Business and Economics, 11th Edition - Page 2 preview image

Loading page image...

Page 3

Solution Manual for Statistics for Business and Economics, 11th Edition - Page 3 preview image

Loading page image...

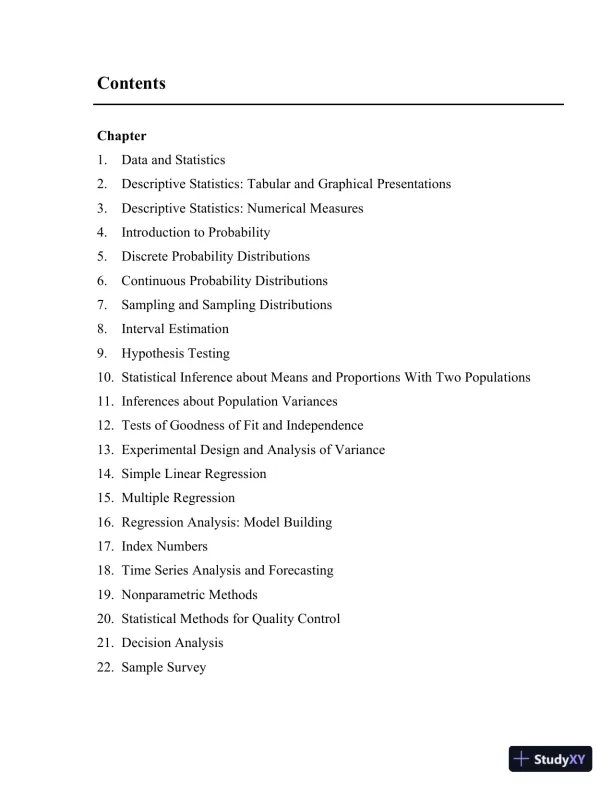
ContentsChapter1.Data and Statistics2.Descriptive Statistics: Tabular and GraphicalPresentations3.Descriptive Statistics: Numerical Measures4.Introduction to Probability5.Discrete Probability Distributions6.Continuous Probability Distributions7.Sampling and Sampling Distributions8.Interval Estimation9.Hypothesis Testing10.Statistical Inference about Means and Proportions With Two Populations11.Inferences about Population Variances12.Tests of Goodness of Fit and Independence13.Experimental Design and Analysis of Variance14.Simple Linear Regression15.Multiple Regression16.Regression Analysis: Model Building17.Index Numbers18.Time Series Analysis andForecasting19.Nonparametric Methods20.Statistical Methods for Quality Control21.Decision Analysis22.Sample Survey

Page 4

Solution Manual for Statistics for Business and Economics, 11th Edition - Page 4 preview image

Loading page image...

PrefaceThe purpose ofStatistics for Business and Economicsis to provide students, primarily inthe fields of business administration and economics, with a sound conceptual introductionto the field of statistics and its many applications. The text is applications-oriented and hasbeen written with the needs of the nonmathematician in mind.The solutions manual furnishes assistance by identifying learning objectives and providingdetailed solutions for all exercises in the text.Note: The solutions to the case problems are included in a separate manual.AcknowledgementsWe would like to provide special recognition to Catherine J. Williams for her efforts inpreparing the solutions manual.David R. AndersonDennis J. SweeneyThomas A. Williams

Page 5

Solution Manual for Statistics for Business and Economics, 11th Edition - Page 5 preview image

Loading page image...

1-1Chapter 1Data and StatisticsLearning Objectives1.Obtain an appreciation for the breadth of statistical applications in business and economics.2.Understand the meaning of the terms elements, variables, and observations as they are used instatistics.3.Obtain an understanding of the difference between categorical, quantitative, crossectional and timeseries data.4.Learn about the sources of data for statistical analysis both internal and external to the firm.5.Be aware of how errors can arise in data.6.Know the meaning of descriptive statistics and statistical inference.7.Be able to distinguish between a population and a sample.8.Understand the role a sample plays in making statistical inferences about the population.9.Know the meaning of the term data mining.10.Be aware of ethical guidelines for statistical practice.Solutions:

Page 6

Solution Manual for Statistics for Business and Economics, 11th Edition - Page 6 preview image

Loading page image...

Chapter 11-21.Statistics can be referred to as numerical facts. In a broader sense, statistics is the field of studydealing with the collection, analysis, presentation and interpretation of data.2.a.The ten elements are the ten carsb.5variables: Size, Cylinders, City MPG, Highway MPG, and Fuelc.Categorical variables:Sizeand FuelQuantitative variables:Cylinders, City MPG, and Highway MPGd.VariableMeasurement ScaleSizeOrdinalCylindersRatioCity MPGRatioHighway MPGRatioFuelNominal3.a.Averagempgfor city driving = 182/10 = 18.2 mpgb.Averagempgfor highway driving = 261/10 = 26.1 mpgOn average, themiles per gallonfor highway driving is26.118.2 =7.9 mpg greatercompared tocity driving.c.3 of 10 or 30% have four cylinder enginesd.6of 10 or60%useregular fuel4.a.The seven elements are the seven schools shownb.5 variables: State, Campus Setting, Endowment, Applicants Admitted, and NCAA Divisionc.Categorical variables: State, Campus Setting, and NCAA DivisionQuantitative variables: Endowment and Applicants Admitted5.a.Average endowment = 74.6/7 = $10.657 billionb.Average percentage admitted = 111/7 = 15.86%c.3 of 7 or 42.9% have NCAA Division III varsity teamsd.3 of 7 or 42.9% have a City: Midsize campus setting6.a.Quantitativeb.Categoricalc.Categoricald.Quantitative

Page 7

Solution Manual for Statistics for Business and Economics, 11th Edition - Page 7 preview image

Loading page image...

Data and Statistics1-3e.Categorical7.a.Although the data are recorded as numbers, the numbers are codes for the ratings of Fair (1),Average (2), Good (3) and Excellent (4). Thus the variables arecategoricalwith each data valuecorresponding to a rating category for thevariable.b.The data may also be ranked in order of the quality. A higher number indicates a higherrating on ascalefrom Fair (1) to Excellent (4). Since the data can be ranked or ordered, the scale ofmeasurement is ordinal.8.a.1015b.Categoricalc.Percentagesd..10(1015) = 101.5101 or 102 respondents said the Federal Bank is doing a good job.9.a.Categoricalb.30 of 71; 42.3%10.a.Quantitative; ratio scale of measurementb.Categorical; nominal scale of measurementc.Categorical; ordinal scale of measurement since the responses can be ordered from earliest (highschool) to latest (retirement)d.Quantitative; ratio scale of measuremente.Categorical; nominal scale of measurement11.a.Quantitative; ratiob.Categorical; ordinalc.Categorical; ordinal (assuming employees can be ranked by classification)d.Quantitative; ratioe.Categorical; nominal12.a.The population is all visitors coming to the state of Hawaii.b.Since airline flights carry the vast majority of visitors to the state, theuse of questionnaires forpassengers during incoming flights is a good way to reach this population. The questionnaireactually appears on the back of a mandatory plants and animals declaration form that passengersmust complete during the incoming flight. A large percentage of passengers complete the visitorinformation questionnaire.c.Questions 1 and 4 provide quantitative data indicating the number of visits and the number of daysin Hawaii. Questions 2 and 3 providecategoricaldata indicating the categories of reason for the tripand where the visitor plans to stay.

Page 8

Solution Manual for Statistics for Business and Economics, 11th Edition - Page 8 preview image

Loading page image...

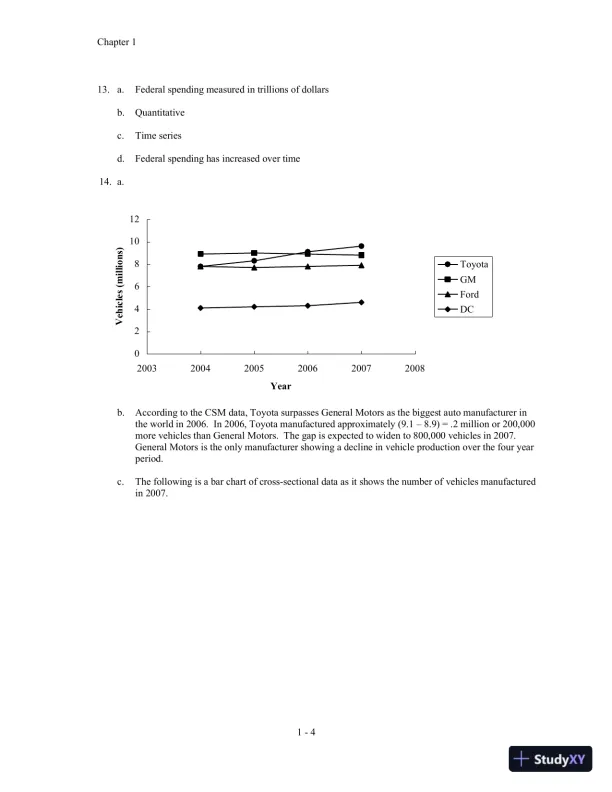
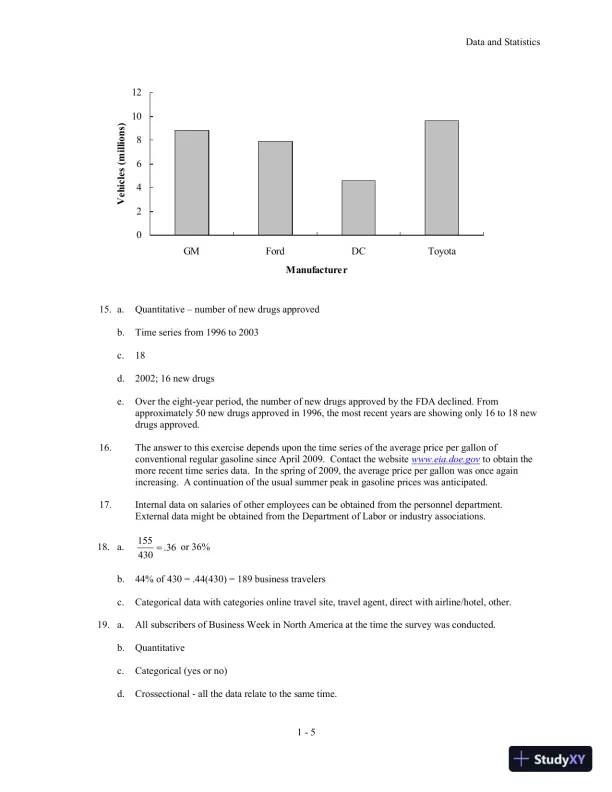
Chapter 11-413.a.Federal spending measured in trillions of dollarsb.Quantitativec.Time seriesd.Federal spending has increased over time14.a.024681012200320042005200620072008YearVehicles (millions)ToyotaGMFordDCb.According to the CSM data, Toyota surpasses General Motors as the biggest auto manufacturer inthe world in 2006. In 2006, Toyota manufactured approximately (9.18.9) = .2 million or 200,000more vehicles than General Motors. The gap is expected to widen to 800,000 vehicles in 2007.General Motors is the only manufacturer showing a decline in vehicle production over the four yearperiod.c.The following is a barchartof cross-sectional data as it shows the number ofvehicles manufacturedin 2007.

Page 9

Solution Manual for Statistics for Business and Economics, 11th Edition - Page 9 preview image

Loading page image...

Data and Statistics1-5024681012GMFordDCToyotaManufacturerVehicles (millions)15.a.Quantitativenumber of new drugs approvedb.Time series from 1996 to 2003c.18d.2002; 16 new drugse.Over the eight-year period, the number of new drugs approved by the FDA declined. Fromapproximately 50 new drugs approved in 1996, the most recent years are showing only 16 to 18 newdrugs approved.16.The answer to this exercise depends upon the time series of the average price per gallon ofconventional regular gasoline since April 2009. Contact the websitewww.eia.doe.govto obtain themore recent time series data. In the spring of 2009, the average price per gallon was once againincreasing. A continuation of the usual summer peak in gasoline prices was anticipated.17.Internal data on salaries of other employees can be obtained from the personnel department.External data might be obtained from the Department of Labor or industry associations.18.a.155.36430=or 36%b.44% of 430 = .44(430) = 189 business travelersc.Categoricaldata with categories online travel site, travel agent, direct with airline/hotel, other.19.a.All subscribers of Business Week in North America at the time the survey was conducted.b.Quantitativec.Categorical(yes or no)d.Crossectional-all the data relate to the same time.

Page 10

Solution Manual for Statistics for Business and Economics, 11th Edition - Page 10 preview image

Loading page image...

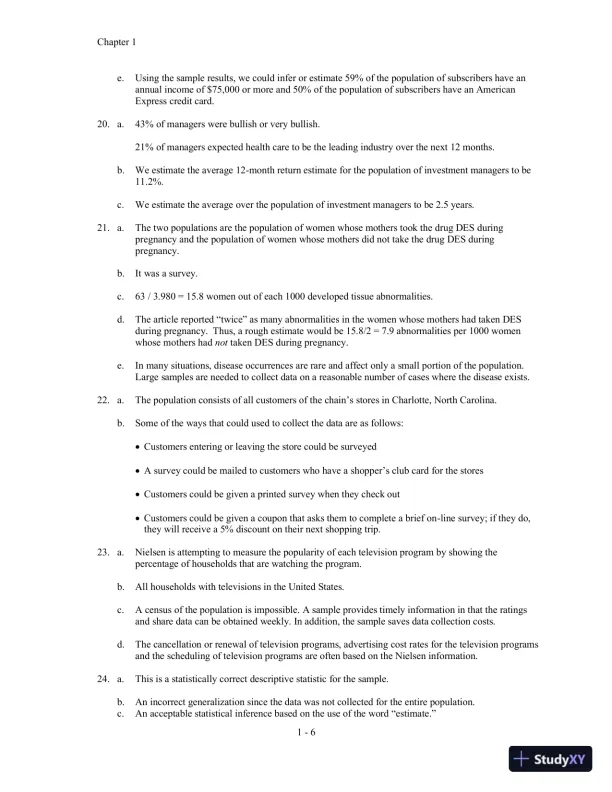
Chapter 11-6e.Using the sample results, we could infer or estimate 59% of the population of subscribers have anannual income of $75,000 or more and 50% of the population of subscribers have an AmericanExpress credit card.20.a.43% of managers were bullish or very bullish.21% of managers expected health care to be the leading industry over the next 12 months.b.We estimate the average 12-month return estimate for the population of investment managers to be11.2%.c.We estimate the average over the population of investment managers to be 2.5 years.21.a.The two populations are the population of women whose mothers took the drug DES duringpregnancy and the population of women whose mothers did not take the drug DES duringpregnancy.b.It was a survey.c.63 /3.980 = 15.8women out of each 1000 developed tissue abnormalities.d.The article reported “twice” as many abnormalities in the women whose mothers had taken DESduring pregnancy. Thus, a rough estimate would be 15.8/2 = 7.9 abnormalities per 1000 womenwhose mothers hadnottaken DES during pregnancy.e.In many situations, disease occurrences are rare and affect only a small portion of the population.Large samples are needed to collect data on a reasonable number of cases where the disease exists.22.a.The population consists of all customers of the chain’s stores in Charlotte, North Carolina.b.Some of the ways that could used to collect the data are as follows:Customers entering or leaving the store could be surveyedA survey could be mailed to customers who have a shopper’s club card for the storesCustomers could be given a printed survey when they check outCustomers could be given a coupon that asks them to complete a brief on-line survey; if they do,they will receive a 5% discount on their next shopping trip.23.a.Nielsen is attempting to measure the popularity of each television program by showing thepercentage of households that are watching the program.b.All households with televisions in the United States.c.A census of the population is impossible. A sample provides timely information in that the ratingsand share data can be obtained weekly. In addition, the sample saves data collection costs.d.The cancellation or renewal of television programs, advertising cost rates for the television programsand the scheduling of television programs are often based on the Nielsen information.24.a.This is a statistically correct descriptive statistic for the sample.b.An incorrect generalization since the data was not collected for the entire population.c.An acceptable statistical inference based on the use of the word “estimate.”

Page 11

Solution Manual for Statistics for Business and Economics, 11th Edition - Page 11 preview image

Loading page image...

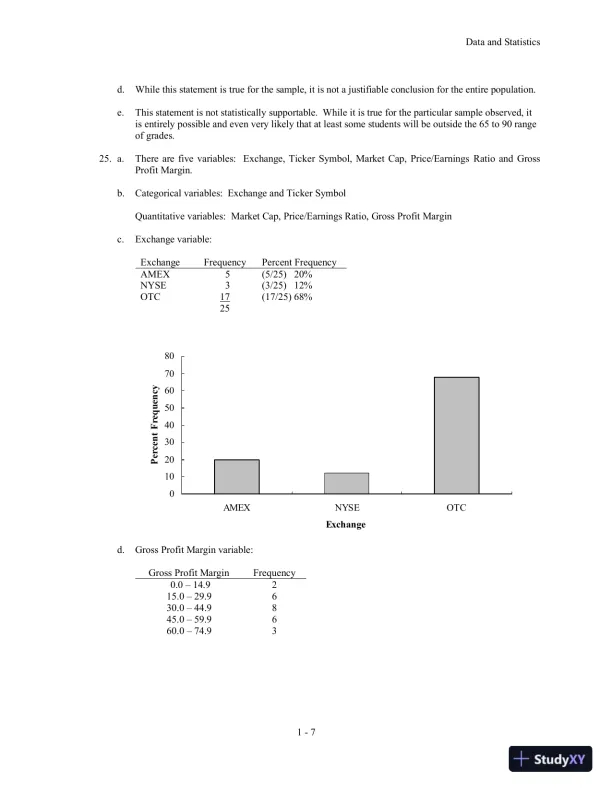
Data and Statistics1-7d.While this statement is true for the sample, it is not a justifiable conclusion for the entire population.e.This statement is not statistically supportable. While it is true for the particular sample observed, itis entirely possible and even very likely that at least some students will be outside the 65 to 90 rangeof grades.25.a.There are five variables:Exchange, Ticker Symbol, Market Cap, Price/EarningsRatio and GrossProfit Margin.b.Categoricalvariables: Exchange and Ticker SymbolQuantitative variables: Market Cap, Price/Earnings Ratio, Gross Profit Marginc.Exchange variable:ExchangeFrequencyPercent FrequencyAMEX5(5/25)20%NYSE3(3/25)12%OTC17(17/25) 68%2501020304050607080AMEXNYSEOTCExchangePercent Frequencyd.Gross Profit Margin variable:Gross Profit MarginFrequency0.014.9215.029.9630.044.9845.059.9660.074.93

Page 12

Solution Manual for Statistics for Business and Economics, 11th Edition - Page 12 preview image

Loading page image...

Chapter 11-801234567890.0-14.915.0-29.930.0-44.945.0-59.960.0-74.9Gross Profit MarginFrequencye.Sum the Price/Earnings Ratio data for all 25 companies.Sum = 505.4Average Price/Earnings Ratio = Sum/25 = 505.4/25 = 20.2

Page 13

Solution Manual for Statistics for Business and Economics, 11th Edition - Page 13 preview image

Loading page image...

2-1Chapter 2Descriptive Statistics: Tabular andGraphicalPresentationsLearning Objectives1.Learn how to construct and interpret summarization procedures for qualitative data suchas:frequency and relative frequency distributions, bar graphs and pie charts.2.Learn how to construct and interpret tabular summarization procedures for quantitative data such as:frequency and relative frequency distributions, cumulative frequency and cumulative relativefrequency distributions.3.Learn how to construct a dot plot, a histogram, and an ogive as graphical summaries of quantitativedata.4.Learn how the shape of a data distribution is revealed by a histogram. Learn how to recognize whena data distribution is negatively skewed, symmetric, and positively skewed.5.Be able to use and interpret the exploratory data analysis technique of a stem-and-leaf display.6.Learn how to construct and interpret cross tabulations and scatter diagrams of bivariate data.

Page 14

Solution Manual for Statistics for Business and Economics, 11th Edition - Page 14 preview image

Loading page image...

Chapter 22-2Solutions:1.ClassFrequencyRelative FrequencyA6060/120 = 0.50B2424/120 = 0.20C3636/120 =0.301201.002.a.1-(.22 + .18 + .40) = .20b..20(200) = 40c/d.ClassFrequencyPercent FrequencyA.22(200) = 4422B.18(200) = 3618C.40(200) = 8040D.20(200)= 4020Total2001003.a.360° x 58/120 = 174°b.360° x 42/120 = 126°c.d.Yes48.3%No Opinion16.7%No35.0%

Page 15

Solution Manual for Statistics for Business and Economics, 11th Edition - Page 15 preview image

Loading page image...

Descriptive Statistics: Tabular and GraphicalPresentations2-3010203040506070YesNoNo OpinionResponseFrequency4.a.Categoricalb.TV ShowFrequencyPercentFrequencyLaw & Order1020%CSI1836%Without a Trace918%Desperate Housewives1326%Total:50100%02468101214161820L&OCSITraceHousewivesTV ShowFrequency

Page 16

Solution Manual for Statistics for Business and Economics, 11th Edition - Page 16 preview image

Loading page image...

Chapter 22-4d.CSI had the largest viewing audience. Desperate Housewives was in second place.5.a.NameFrequencyRelative FrequencyPercent FrequencyBrown7.1414%Davis6.1212%Johnson10.2020%Jones7.1414%Smith12.2424%Williams8.1616%501.00b.02468101214BrownDavisJohnsonJonesSmithWilliamsNameFrequencyc.Brown.14 x 360 = 50.4Davis.12 x 360 = 43.2Johnson.20 x 360 = 72.0Jones.14 x 360 = 50.4Smith.24 x 360 = 86.4Williams.16 x 360 = 57.6L&O20%CSI36%Trace18%Housewives26%

Page 17

Solution Manual for Statistics for Business and Economics, 11th Edition - Page 17 preview image

Loading page image...

Descriptive Statistics: Tabular and GraphicalPresentations2-5d.Most common: Smith, Johnson and Williams6.a.NetworkFrequencyPercent FrequencyABC1530%CBS1734%FOX12%NBC1734%Total50100%024681012141618ABCCBSFOXNBCNetworkFrequencyb.CBS and NBC are tied, each with 17 of the top rated television shows. ABC is aclose third with 15.The fact that the three networks are so close is surprising.FOX, the newest television network, doesnot have the history to compete with the other three networks in term of the top rated shows intelevision history.Williams16%Brown14%Davis12%Johnson20%Jones14%Smith24%

Page 18

Solution Manual for Statistics for Business and Economics, 11th Edition - Page 18 preview image

Loading page image...

Chapter 22-67.RatingFrequencyRelative FrequencyOutstanding190.38Very Good130.26Good100.20Average60.12Poor20.04501.00Management should be pleased with these results. 64% of the ratings are very good to outstanding.84% of the ratings are good or better. Comparing these ratings with previous results will showwhether or not the restaurant is making improvements in its ratings of food quality.8.a.PositionFrequencyRelative FrequencyPitcher170.309Catcher40.0731st Base50.0912nd Base40.0733rd Base20.036Shortstop50.091Left Field60.109Center Field50.091Right Field70.127551.000b.Pitchers (Almost 31%)c.3rd Base (3-4%)d.Right Field (Almost 13%)e.Infielders (16 or 29.1%) to Outfielders (18 or 32.7%)9.a.b.Where do you live now?Living AreaLive NowIdealCommunityCity32%24%Suburb26%25%Small Town26%30%Rural Area16%21%Total100%100%

Page 19

Solution Manual for Statistics for Business and Economics, 11th Edition - Page 19 preview image

Loading page image...

Descriptive Statistics: Tabular and GraphicalPresentations2-7What do you consider the ideal community?c.Most adults are now living in a city (32%).d.Most adults consider the ideal community a small town (30%).e.Percent changes by living area: City-8%, Suburb-1%, Small Town +4%, and Rural Area +5%.Suburb living is steady, but the trend would be that living in the city would decline whileliving in small towns and rural areas would increase.10.a.RatingFrequencyExcellent20Good101Fair528Bad244Terrible122Total1015b.

Page 20

Solution Manual for Statistics for Business and Economics, 11th Edition - Page 20 preview image

Loading page image...

Chapter 22-8RatingPercentFrequencyExcellent2Good10Fair52Bad24Terrible12Total100c.d.24% + 12% = 36% of adults in the United Sates think the Federal Bank is doing a bad or a terriblejob in handling the credit problems. Only 10% + 2% = 12% think the Federal Bank is doing a goodor excellent job.e.40% + 10% = 50% of adults in Spain think the European Central Bank is doing a bad or terrible jobin handling the credit problems. Only 4% of adults in Spain think the European Central Bank isdoing a good or excellent job.Both countries show pessimism and relatively low confidence in how the banks are handling thecredit problems in the financial markets. But in comparing the two countries, adults in Spain showmore concern and more pessimism about the bank’s ability compared to adults in the United States.11.ClassFrequencyRelative FrequencyPercent Frequency12-1420.0505.015-1780.20020.018-20110.27527.521-23100.25025.024-2690.22522.5Total401.000100.012.ClassCumulative FrequencyCumulative Relative Frequency

Page 21

Solution Manual for Statistics for Business and Economics, 11th Edition - Page 21 preview image

Loading page image...

Descriptive Statistics: Tabular and GraphicalPresentations2-9less than or equal to 1910.20less than or equal to 2924.48less than or equal to 3941.82less than or equal to 4948.96less than or equal to 59501.0013.02468101214161810-1920-2930-3940-4950-59Frequency.2.4.6.8010203040501.06014.a.b/c.

Page 22

Solution Manual for Statistics for Business and Economics, 11th Edition - Page 22 preview image

Loading page image...

Chapter 22-10ClassFrequencyPercent Frequency6.0-7.94208.0-9.921010.0-11.984012.0-13.931514.0-15.93152010015.a/b.Waiting TimeFrequencyRelative Frequency0-440.205-980.4010-1450.2515-1920.1020-2410.05Totals201.00c/d.Waiting TimeCumulative FrequencyCumulative Relative FrequencyLess than or equal to 440.20Less than or equal to 9120.60Less than or equal to 14170.85Less than or equal to 19190.95Less than or equal to 24201.00e.12/20 = 0.6016.a.SalaryFrequency150-1591160-1693170-1797180-1895190-1991200-2092210-2191Total20b.SalaryPercentFrequency150-1595160-16915170-17935180-18925190-1995200-20910210-2195Total100c.SalaryCumulative PercentFrequency

Page 23

Solution Manual for Statistics for Business and Economics, 11th Edition - Page 23 preview image

Loading page image...

Descriptive Statistics: Tabular and GraphicalPresentations2-11Less than or equal to 1595Less than or equal to 16920Less than or equal to 17955Less than or equal to 18980Less than or equal to 19985Less than or equal to 20995Less than or equal to 219100Total100d.e.There is skewness to the right.f.(3/20)(100) = 15%17.a.The highest price stock is for IBM with a price of $107per share.The lowest price stock is for Alcoa with a price of $11 per share.b.A class size of 10 results in 10 classes.Price per ShareFrequency$10-195$20-2910$30-393$40-492$50-596$60-692$70-791$80-890$90-990$100-1091c.

Page 24

Solution Manual for Statistics for Business and Economics, 11th Edition - Page 24 preview image

Loading page image...

Chapter 22-12The general shape of the distribution is skewed to the right. Half of the companies (15) have a priceper share less than $30. A mid-priced stock appears to be in the $30 to $49 range, while the mostfrequently priced stock is in the $20 to $29 range.Five stocks are less than $20 per share (Alcoa, Bank of America, General Electric, Intel and Pfizer).Four stocks are $60 or more per share (3M, Chevron, ExxonMobil and IBM).d.A variety of comparisons are possible depending upon when the study is done.18.a.The lowest holiday spending is $180; the highest $2050.b.SpendingFrequencyPercent0-249312250-499624500-749520750-9995201000-12493121250-1499141500-1759001750-1999142000-224914Total25100c.The distribution shows a positive skewness.

Page 25

Solution Manual for Statistics for Business and Economics, 11th Edition - Page 25 preview image

Loading page image...

Descriptive Statistics: Tabular and GraphicalPresentations2-13012345670-249250-499500-749750-9991000-12491250-14991500-17591750-19992000-2249Holiday SpendingFrequencyd.The holiday spending ranges from $0 to less than $2250. The majority of thespending is between$250 and $1000 with 16 of the 25 customers, 64%, in thisrange. The middle or average spending is around$750 per customer. Thedistribution has a positive skewness with two consumers above $1750. Oneconsumeris above $2000.19.a/b/c/d.Class(Minutes)FrequencyRelativeFrequencyCumulativeFrequencyCumulative RelativeFrequency1-512.6012.606-103.1515.7511-152.1017.8516-201.0518.9021-251.0519.9526-300.0019.9531-341.05201.00e.f.60% of office workers spend 5 minutes or less on unsolicited email and spam. However, 25% ofoffice workers spend more than 10 minutes per day on this task.20.a.Off-Course IncomePercent00.20.40.60.8105101520253035Time

Page 26

Solution Manual for Statistics for Business and Economics, 11th Edition - Page 26 preview image

Loading page image...

Chapter 22-14($1000s)FrequencyFrequency0-4,99930605,000-9,99991810,000-14,9994815,000-19,9990020,000-24,9993625,000-29,9992430,000-34,9990035000-39,9990040,000-44,9991245,000-49,99900Over 50,00012Total50100b.Histogram of Off-Course IncomeNote: The first class is labeled 5000 and provides the golfers who had an off-course income in therange 0 to 4999 orless than5000. These were the golfers with less than $5 million in off-courseincome.c.Off-course income is skewed to the right. Only Tiger Woods earns over $50 million.d.Considering the top 50 golfers, the majority (60%) earn less than $5 million in off-course income peryear. 60% + 18% = 78% earn less than $10 million. Five golfers (10%) earn between $20 millionand $30 million. Tiger Woods with $99.8 million and Phil Mickelson with $40.2 million in off-course income are clearly the leaders in this income category.21.a/b.

Page 27

Solution Manual for Statistics for Business and Economics, 11th Edition - Page 27 preview image

Loading page image...

Descriptive Statistics: Tabular and GraphicalPresentations2-15ComputerUsage (Hours)FrequencyRelativeFrequency0.0-2.950.103.0-5.9280.566.0-8.980.169.0-11.960.1212.0-14.930.06Total501.00c.0510152025300-2.93-5.96-8.99-11.912-14.9Computer Usage (Hours)Frequencyd.e.The majority of the computer users are in the 3 to 6 hour range. Usage is somewhat skewed towardthe right with 3 users in the 12 to 14.9 hour range.22.

Page 28

Solution Manual for Statistics for Business and Economics, 11th Edition - Page 28 preview image

Loading page image...

Chapter 22-165786458702255688023523.Leaf Unit = .1637557813489361004511324.Leaf Unit = 1011612021306714227155160281702325.98910246611457889122457131214415126.a.100 shares at $50 per share

Page 29

Solution Manual for Statistics for Business and Economics, 11th Edition - Page 29 preview image

Loading page image...

Descriptive Statistics: Tabular and GraphicalPresentations2-1710377245530055940005585000455This stem-and-leaf display shows that the trading prices are closely grouped together. Rotating thestem-and-leaf display counter clockwise shows a histogram that is slightly skewed to the left but isroughly symmetric.b.500 shares traded online at $50 per share.057101134155582000000255300036445563This stretched stem-and-leaf display shows that the distribution of online trading prices for most ofthe brokers for 500 shares are lower than the trading prices for broker assisted trades of 100 shares.There are a couple of outliers. York Securities charges $36 for an online trade and Investors Nationalcharges much more than the other brokers: $62.50 for an online trade.27.a.75 9836956810044111 5121371455b.Observations such asthefollowingcan be madeusing the stem-and-leaf display.

Page 30

Solution Manual for Statistics for Business and Economics, 11th Edition - Page 30 preview image

Loading page image...

Chapter 22-18The daily rate varies from $75 to $145Typical mid-priced daily rates are $95 to $115 with the average daily rate around $100.A daily ratein excess of $115 should be considered relatively high. High daily rates of $137 and$145 were found at three ski resorts.28.a.21 426 730 1 1 1 2 335 6 7 740 0 3 3 3 3 3 4 446 6 7 950 0 0 2 255 6 7 961 46672b.Most frequent age group: 40-44 with 9 runnersc.43 was the most frequent age with 5 runnersd.4/40 = 10% of the runners were “20-something.” With only 10% of the registrants “20-something,”the article pointed out that surprisingly few registrants were in this age group. One suggested reasonwas that “20-somethings” don’t have the time to train for a 13.1 mile race. For “20-somethings,”college, starting careers, and starting families may take priority over training for long distance races.29.a.yxABC5112021012185131230Total12Totalb.

Page 31

Solution Manual for Statistics for Business and Economics, 11th Edition - Page 31 preview image

Loading page image...

Descriptive Statistics: Tabular and GraphicalPresentations2-19yxABC100.084.616.710.015.483.32100.0100.0100.0Totalc.yxABC27.861.111.1100.00.016.783.3100.012Totald.Category A values forxare always associated with category 1 values fory. Category B values forxare usually associated with category 1 values for y. Category C values forxare usually associatedwith category 2 values fory.30.a.-40-24-88244056-40-30-20-10010203040xyb.There is a negative relationship betweenxandy; ydecreases asxincreases.
Preview Mode

This document has 686 pages. Sign in to access the full document!

Study Now!

XY-Copilot AI
Unlimited Access
Secure Payment
Instant Access
24/7 Support
Document Chat

Document Details

Subject
Economics

Related Documents

View all