Solution Manual for Photovoltaic Systems Engineering, 4th Edition

Solution Manual for Photovoltaic Systems Engineering, 4th Edition makes solving textbook exercises easier with step-by-step solutions and helpful tips.

Mia Johnson
Contributor
4.3
59
5 months ago
Preview (16 of 75 Pages)
100%
Purchase to unlock

Page 1

Solution Manual for Photovoltaic Systems Engineering, 4th Edition - Page 1 preview image

Loading page image...

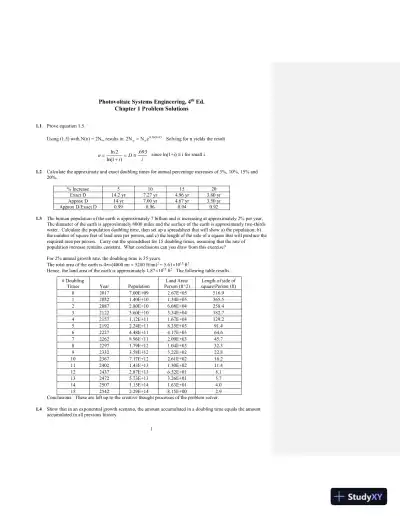
1Photovoltaic Systems Engineering, 4thEd.Chapter 1 Problem Solutions1.1Prove equation 1.5.Using (1.5) with N(n) = 2No, results in)i1ln(nooeNN2. Solving for n yields the resultiDin693.)1ln(2lnsince ln(1+i)i for small i.1.2Calculate the approximate and exact doubling times for annual percentage increases of 5%, 10%, 15% and20%.% Increase5101520Exact D14.2 yr7.27 yr4.96 yr3.80 yrApprox D14 yr7.00 yr4.67 yr3.50 yrApprox D/Exact D0.990.960.940.921.3The human population of the earth is approximately 7 billion and is increasing at approximately 2% per year.The diameter of the earth is approximately 8000 miles and the surface of the earth is approximately two-thirdswater. Calculate the population doubling time, then set up a spreadsheet that will show a) the population, b)the number of square feet of land area per person, and c) the length of the side of a square that will prod uce therequired area per person.Carry out the spreadsheet for 15 doubling times, assuming that the rate ofpopulation increase remains constant. What conclusions can you draw from this exercise?For 2% annual growth rate, the doubling time is 35 years.The total area of the earth is 4(4000 mi5280 ft/mi)2= 5.611015ft2.Hence, the land area of the earth is approximately 1.871015ft2. The following table results.# DoublingTimesYearPopulationLand Area/Person (ft^2)Length of side ofsquare/Person (ft)020177.00E+092.67E+05516.9120521.40E+101.34E+05365.5220872.80E+106.68E+04258.4321225.60E+103.34E+04182.7421571.12E+111.67E+04129.2521922.24E+118.35E+0391.4622274.48E+114.17E+0364.6722628.96E+112.09E+0345.7822971.79E+121.04E+0332.3923323.58E+125.22E+0222.81023677.17E+122.61E+0216.21124021.43E+131.30E+0211.41224372.87E+136.52E+018.11324725.73E+133.26E+015.71425071.15E+141.63E+014.01525422.29E+148.15E+002.9Conclusions: These are left up to the creative thought processes of the problem solver.1.4Show that in an exponential growth scenario, the amount accumulated in a doubling time equals the amountaccumulated in all previous history.

Page 2

Solution Manual for Photovoltaic Systems Engineering, 4th Edition - Page 2 preview image

Loading page image...

Page 3

Solution Manual for Photovoltaic Systems Engineering, 4th Edition - Page 3 preview image

Loading page image...

2Let T represent the doubling time, r the rate, P0the initial population, and let t>0 represent any arbitrary time.The problem is to show thattr)(1Pr)(1Pr)(1P0t0tT0. This is equivalent to showing0T02Pr)(1P, which is true by assumption (this equation is what it means for T to be the doubling time).1.5Assume there is enough coal left to last for another 300 years at current consumption rates.a.Determine how long the coal will last if its use is increased at a rate of 5% per year.b. If there is enough coal to last for 10,000 years at current consumption rates, then how long will it last if itsuse increases by 5% per year?c.Can you predict any other possible consequences if coal burning increases at 5% per year for the short orlong term?d. Determine the annual percent reduction in coal consumption to ensure that coal will last forever, assumingthe 300-year lifetime at present consumption rates.Using (1.9)a)36.56)05.01ln(]1)05.01ln(300ln[myrb)91.126)05.01ln(]1)05.01ln(10000ln[myrc) To mention a few: significant increases in CO, CO2, NO2, SO2and particulates in the air, affecting acidrain, global warming and respiratory ailments.d)Set)n1ln(]1)n1ln(300ln[mand solve for n. Note that if n < 0, then ln(1+n) < 0.Also, if [300ln(1+n) + 1] = 0, then ln[300ln(1+n) + 1] =. So ln(1+n) =1/300 and, hence,3300110328.31en, or, approximately 0.333% per year decrease in consumption to ensure thesupply will last forever.1.6The half-life is the time it takes to decay exponentially to half the original amount. If the half-life of aradioactive isotope is 500 years, how many years will it take for an amount of the isotope to decay to 1% of itsoriginal value? Assume the isotope decays exponentially.The time constant is given by5.721693.5002lnt2/1yr. Hence, setting01.0etand solving for t givesthe result3323100ln5.721100lntyr.1.7If a colony of bacteria lives in a jar and doubles in number every day, and it takes 30 days to fill the jar withbacteria,a.How long does it take for the jar to be half full?b. How long before the bacteria notice they have a problem? (You may want to pretend you are a bacterium.)c. If on the 30th day, 3 more jars are found, how much longer will the colony be able to continue to multiplyat its present rate?a) 29 daysb) Probably about when the jar is about 1/8 full. This is 3 days before the jar will.be full. It sort of depends whether bacteria are as smart as humans.c) 2 more days1.8An enterprising young engineer enters an interesting salary agreement with an employer. She agrees to workfor a penny the first day, 2 cents the second, 4 cents the third, and so on, each day doubling the amount of theprevious day. Set up a spreadsheet that will show her daily and cumulative earnings for her first 30 days ofemployment.

Page 4

Solution Manual for Photovoltaic Systems Engineering, 4th Edition - Page 4 preview image

Loading page image...

3DayDailyEarningsCumulativeEarningsDayDailyEarningsCumulativeEarnings1$0.01$0.0116327.68655.352$0.02$0.0317$655.36$1,310.713$0.04$0.0718$1,310.72$2,621.434$0.08$0.1519$2,621.44$5,242.875$0.16$0.3120$5,242.88$10,485.756$0.32$0.6321$10,485.76$20,971.517$0.64$1.2722$20,971.52$41,943.038$1.28$2.5523$41,943.04$83,886.079$2.56$5.1124$83,886.08$167,772.1510$5.12$10.2325$167,772.16$335,544.3111$10.24$20.4726$335,544.32$671,088.6312$20.48$40.9527$671,088.64$1,342,177.2713$40.96$81.9128$1,342,177.28$2,684,354.5514$81.92$163.8329$2,684,354.56$5,368,709.1115$163.84$327.6730$5,368,709.12$10,737,418.231.9Burning a gallon of petroleum produces approximately 25 pounds of carbon dioxide and burning a ton of coalproduces approximately 7000 pounds of carbon dioxide.a.If a barrel of petroleum contains 42 gallons, if the world consumes 80 million barrels of petroleum per dayand if the atmosphere weighs 14.7 pounds per square inch of earth surface area, calculate the weight ofcarbon dioxide generated each year from burning petroleum and compare this amount with the weight ofthe atmosphere.b. If a total of 16 million tons of coal are burned every day on the earth, calculate the weight of carbondioxide generated each year from coal burning and compare it with the weight of the atmosphere.a) (25 lb CO2/gal)(42 gal/bbl)(80106bbl/day)(365 days/yr) = 3.0661013lb/yr.The atmosphere weighs(14.7 lb/in2)(5.611015ft2)(144 in2/ft2) = 1.1881019lb.Hence, annual CO2production is 2.58410-4% of the total weight of the atmosphere under the assumptionsgiven.b) (16106ton/day)(7000 lb CO2/ton)(365 days/yr) = 4.0881013lb/yr, or 3.44510-4% of the weight of theatmosphere under the assumptions given.1.10Assume a world population of 7.3 billion and a U.S. population of 323 million.a.Look up the present total annual U.S. primary energy consumption. Then determine the total world energyconsumption in quads if the rest of the world were to use the same per capita energy as in the U.S.b. If the energy source mix were to remain the same as the present mix in achieving the scenario of part a,what would be the percentage increase in CO2emissions?a) The US EIA shows 97 quads of U.S. Primary Energy Consumption in 2013 and total world primary energyconsumption of 543 quads. The U. S. fraction of total world primary consumption thus was 18% in 2013.Thus,on a per person basis, U.S. energy consumption was 97x1015Btu/323x106people = 3x10⁸Btu/persand worldwide energy consumption is 543x1015Btu/7.3x109people = 7.44x10⁷Btu/pers.Thus, if everyone used 3x10⁸ Btu/yr, total world consumption would have been 7.3x109x3x108=21.9x10¹⁷Btu = 2,190 quads, which is 4.03 times the actual consumption.b) For the same energy mix, the CO2production rate would be 4.03 times as much, or 403% of the actual2013 rate.

Page 5

Solution Manual for Photovoltaic Systems Engineering, 4th Edition - Page 5 preview image

Loading page image...

41.11Obtain data on worldwide energy consumption by sector from the United States Department of Energy, EnergyInformation Administration website. Plot the data and estimate annual percentage growth rates for the sevenregions reported and then for the world.Note that the sectors listed on the EIA website include residential, industrial, commercial and transportation.The seven regions of the world, as called for in the problem, are: North America, Central and South America,Europe, Eurasia, Middle East, Africa, Asia and Oceania. New data becomes available frequently, so the readeris invited to access this data and plot historic trends. The end product might be a set of graphs with energy useby sector for each region, or vice versa. There is a lot of data that can be massaged in the various databases,with projections of energy use. These projections can then be compared with projections made by the EIA.1.12The following measurements of x(t) are made:t012.33.04.55.26.58.0x2.18.43165360850370020,000Construct a semilog plot of x(t) either manually or with a computer, and determine whether the functionappears to have an exponential dependence. If so, determine x(t).The semi-log plot as an Excel plot is as follows:This is clearly a pretty good straight line on semilogarithmic coordinates. The function can thus be representedfairly closely asbt)10(Ax, where A = 2.1 and497.08979.3081.2log20000logttxlogxlogb1212.Alternatively, using the Excel trendline option yields x = 2.2995e1.1334twith an R2value of 0.9994.Since et= 10tloge, x can also be expressed as x = 2.2995(10)0.4922t, which is reasonably close to thegraphical estimate.1.13a. What does the area under the Gaussian curve represent?b. Show that 68% of the area under the Gaussian curve lies within one standard deviation, s, of maximumvalue of the function.c. What percentage of the area lies within 2s?a) The area under the Gaussian curve represents the total sample, or total supply.b) This is probably most easily proven by a numerical integration or else by looking up the function in a bookof tables, such as theCRC Standard Mathematical Tables. The 20th Edition of theCRC StandardMathematical Tablestabulates the Normal probability function and related functions, beginning on p. 582.110100100010000100000012345678

Page 6

Solution Manual for Photovoltaic Systems Engineering, 4th Edition - Page 6 preview image

Loading page image...

5For one standard deviation from the mean, x = 1.00. F(1) represents the area under the curve between x =and x = 1.00, which is tabulated as 0.8413.Note that f(x) is normalized so that F() = 1.00. Since f(x) issymmetrical about x = 0, this means that the area under the curve between x = 0 and x = 1 is 0.84130.500 =0.3413. Thus, the area between x =1 and x = 0 is also 0.3413,so the area between x =1 and x = 1 is0.6826. Hence, 68.26% of the distribution lies within 1 standard deviation of the mean.c) In a similar fashion, F(2) = 0.9772. Hence, 2(0.9772-0.500) = 0.954, or, 95.4% of the distribution lieswithin 2 standard deviations of the mean.1.14Determine Rm, toand s for the worldwide graph of Figure 1.8.The worldwide graph shows Rm36.5109bbl/yr consumption rate occurring somewhere near the year 2005.The Gaussian function has the property that it has decreased to 60.7% of its peak value at one standarddeviation from the peak (mean). Thus, .607Rm= 22.2109bbl/yr, occurs at the years 1980 and 2030. So s25 years and hence this implies that 68% of the world’s petroleum will be used between the years 1980 and2030.1.15Look up actual U. S. and World petroleum production figures and plot them on Hubbert’s curves to comparethe actual production with the theoretical production.Data is available from the U.S. Energy Information Agency. 2016 World production 96 million barrels/day.2015 US production 9.25 million barrels/day. These figures change monthly, but the idea is to see where theylie on the Hubbert curve, so they need to be converted to barrels/yr. The results: U.S. = 3.4x10⁹and World =35x109. 2016 Hubbert curves show U.S.2x109barrels/yr and World35x109barrels/yr. Is this interesting,or what?1.16Based on the data of Figure 1.9,a. Estimate the year when PV shipments will reach 100 GW.b. Estimate the year when PV shipments will reach 1,000 GW.c. Estimate the year when PV shipments will reach 2,700 GW.The annual percent increase needs to be estimated from Figure 1.9. Since there is some uncertainty involved inpredicting the future, one needs to decide upon how much of the curve of Figure 1.9 to use to estimate theannual growth rate, since the slope of the curve is time dependent. Noting the recent trend, since about 2000,estimates can be made of shipments between 2000 and 2015 from the data on Figure 1.9 as follows:Year200020032006200920122015Normalized year (t)03691215GW shipped (GW)0.220.551.77.530.050.0Plotting this data in Excel and obtaining the best exponential curve fit yields GW = 0.200e0.3868twith R2=0.9875, a reasonable fit.Thus, to determine t to reach a particular value of GW, solve the equation for t to get200MW(t)ln0.38681t.ThusGW(t) = 100 GW when t = 16 yr(i.e., in 2016)GW(t) = 1,000 GW when t = 22 yr(i.e., in 2022)GW(t) = 2,700 GW when t = 24.6 yr(i.e., in 2025)1.17The Earth Policy Institute [31] reports the following worldwide PV production figures. Plot the data on anExcel graph, establish an equation to represent the data, and then answer the three questions posed in Problem1.16. Compare the results of the two problems.

Page 7

Solution Manual for Photovoltaic Systems Engineering, 4th Edition - Page 7 preview image

Loading page image...

6Year199519961997199819992000200120022003200420052006MW77.688.6126155201277386547748119417862521Remember to set 1995 as year 0. An Excel plot will giveMW = 62.5570e0.3226twith R2= 0.9897. Hence, solving for t gives62.5570MW(t)ln0.32261t.ThusMW(t) = 10,000 MW when t = 15.7yr(i.e., in 2010)MW(t) = 50,000 MW when t = 20.7 yr(i.e., in 2015)MW(t) = 2700 GW = 2,700,000 MW when t = 33.1 yr(i.e., in 2028)An unnamed philosopher once claimed that the future will be different from the past. Which, if either, scenariofrom the last 2 problems do you think is more realistic? What might happen to change the trend in eitherdirection?

Page 8

Solution Manual for Photovoltaic Systems Engineering, 4th Edition - Page 8 preview image

Loading page image...

7Chapter 2 Problem Solutions2.1Show that, for a surface temperature of 5800 K, the sun will deliver 1367 W/m2to the Earth. This requiresintegration of the blackbody radiation formula over all wavelengths to determine the total available ene rgy atthe surface of the sun in W/m2. Numerical integration is recommended. Be careful to note the range ofwavelengths that contribute the most to the spectrum. Then note that the energy density decreases as thesquare of the distance from the source, similar to the behavior of an electric field emanating from a pointsource. The diameter of the sun is 1.393109m, and the mean distance from sun to Earth is 1.51011m.Start by plugging the values of the various constants along with T = 5800 K into (2.1). This gives1e10749.3w6104845.2516W/m2/m .This expression must now be integrated over the interval 0 <<. Since most of the spectral intensityappears in the wavelength range between 0.1 and 5m, values for evaluating the expression must be carefullychosen if numerical integration is chosen.The result of the integration is701044.6dwW/m2.Since this is the power density at the surface of the sun, the total power of the sun can be found by multiplyingthis power density by the surface area of the sun. The result isP = (6.44107W/m2)(4)(0.51.393109m)2= 3.9261026W.This power is radiated uniformly in all directions. The power density at the earth is thus found from the totalpower of the sun divided by the area of the sphere surrounding the sun with radius equal to the distance fromthe sun to the earth. The result is1389m10827.2W10926.3APS22326W/m2,which compares nicely with the value 1367 W/m2that results from the not-quite-perfect blackbody spectrumreceived by the earth.2.2If the diameter of the sun is 1.393109m, and if the average density of the sun is approximately 1.4thedensity of water, and if 21019kg/yr of hydrogen is consumed by fusion, how long will it take for the sun toconsume 25% of its mass in the fusion process?The density of 1.4 means the density of the sun is 1.4103 kg/m3 . The mass of the sun thus computes to be1.9811030kg. Hence, 25% of the sun’s mass is 4.9531029kg.Hence, (4.9531029kg)(21019kg/yr) = 24.76 billion years.2.3Calculate the zenith angles needed to produce AM 1.5 and AM 2.0 if AM 1.0 occurs at zero degrees.AM = AM(90o)csc. Thus, if AM(90o) = 1.0, then for AM = 1.5, csc= 1.5 and= 41.81o.If= 41.81o, thenZ= 90= 48.19o.For AM = 2, sin= 0.5 so that= 30oandZ= 90= 60o.2.4Calculate the zenith angle at solar noon at a latitude of 40onorth on May 1.At solar noon,Z== 40o365)80121(360sin45.23o= 24.79o.2.5Calculate the number of hours the sun was above the horizon on your birthday at your birthplace.

Page 9

Solution Manual for Photovoltaic Systems Engineering, 4th Edition - Page 9 preview image

Loading page image...

8To find n to find, the date is needed. Then the latitude of the birthplace is needed. Finally, solving (2.8)gives5.7)tantan(cosDH1hr .2.6Calculate the irradiance of sunlight for AM 1.5 and for AM 2.0, assuming no cloud cover, using (2.2) and(2.3). Then write a computer program that will plot irradiance vs. AM for 1AM10 for each equation.Equation (2.2) results in irradiance = 801 W/m2for AM1.5 and irradiance = 670 W/m2for AM2.0.Equation (2.3) results in irradiance = 855 W/m2for AM1.5 and irradiance = 772.5 W/m2for AM2.0.Irradiance vs. Air Mass using (2.2)Irradiance vs. Air Mass using (2.3)2.7Assume no cloud cover, and, hence, that the solar irradiance is predominantly a beam component. If anontracking collector is perpendicular to the incident radiation at solar noon, estimate the irradiance on thecollector at 1, 2, 3, 4, 5 and 6 hours past solar noon, taking into account air mass and collector orientation.Then estimate the total daily irradiation on the collector in kWh. Assume AM 1.0 at solar noon and a latitudeof 20N.AM1.0 at solar noon means the sun is directly overhead, or= 90oand= 0o. This means the collector ishorizontal. Thus, to calculate the direct beam irradiation on the collector at 2, 3 and 4 hours past solar noon, itis necessary to calculateat these times.020040060080010000246810010020030040050060070080090010000246810

Page 10

Solution Manual for Photovoltaic Systems Engineering, 4th Edition - Page 10 preview image

Loading page image...

9To find, (2.9) is used:coscoscossinsinsinAt solar noon, the hour angle,= 0. Also if the sun is directly overhead,=so= 90o.Since -23.45o<< 23.45o, it is necessary to choose a location to determine. If= 20oN, it is possibleto evaluatefor times when0.So, at 2 hours past solar noon,=30oand8817.0)30cos(20cos20sinsinoo2o2so= 61.85o.Similarly, at 3 hours past solar noon,= 47.85o, and at 4 hours past solar noon,= 33.95o.Next, for the calculated solar altitudes, the air mass and then the irradiance need to be calculated. Using (2.3),the following table can be generated for solar altitude, air mass, irradiance and the component of irradiance onthe horizontal array, given by (Irradiance)(sin):Timesin, degreesAMIrradiance,W/m2Direct arraycomponent, W/m2Solar noon1.0000901.000957957noon + 10.969975.91.020950921noon + 20.881761.91.134927817noon + 30.741447.91.349883655noon + 40.558534.01.791805450noon + 50.345520.22.894657227noon + 60.11706.78.5529735An estimate of the total daily irradiation on the collector can then be made by summing the direct arraycomponents multiplied by appropriate time intervals. Assuming the solar noon component from 11:30 a.m.to 12:30 p.m., the noon + 1 component from 12:30 to 1:30 p.m. and 10:30 to 11:30 a.m., the noon + 2 valuefrom 1:30 to 2:30 p.m. and 9:30 to 10:30 a.m., etc., the approximate total output of the array due to thedirect component of the incident sunlight over the 12-hour period becomeskWh/day = 0.957 + 2(0.921 + 0.817 + 0.655 + 0.450 + 0.227 + 0.035) = 7.167 .2.8Write a computer program using Matlab, Excel or something similar that will plot solar altitude vs. azimuth.Plot sets of curves similar to Figure 2.8 for the months of March, June, September and December for Denver,CO, Mexico City, Mexico, and Fairbanks, AK.The program needs to plotandas determined by (2.9) and (2.10), with appropriate values ofandfor the months and the locations. Note that sincereaches its maximum and minimum values on or about the21stof June and December, rather than at the 15thof the months, the curves for May and July, April andAugust, etc., will be slightly different.2.9Using eq. (2.9 and 2.10), show that at solar noon,Z=and= 0.Start with equation (2.9) since it does not depend on. Using some trigonometric identities, and=0 at solarnoon gives:δ)cos(φcosφcosδsinsinδsinα)θsin(90cosθZZφ.This givesZ= ±().Explain why it isn’t the negative.Now for equation (2.10). Using the result from above, and a trigonometric identity, we have:cosαcosφsinαsinφα)cos(φ90)αsin(φ)θsin(φsinδZ.Plugging this value into equation 2.10 gives the answer.

Page 11

Solution Manual for Photovoltaic Systems Engineering, 4th Edition - Page 11 preview image

Loading page image...

102.10Write a computer program that will generate a plot of solar altitude vs. azimuth for the 12 months of the yearfor your home town. It would be nice if each curve would have time-of-day indicators.Appropriate choices need to be made forandfor use of (2.9) and (2.10) again.2.11Neglecting the analemma effect, calculate the time of day at which solar noon would occur at your longitude.Then compare the north indicated by a compass, corrected for compass declination, with the north indicated bya shadow at calculated solar noon and estimate the error in the shadow direction (i.e., solar noon) due to theanalemma effect. Estimate actual solar noon time on the basis of the difference between compass north andthe shadow “north.”True north is in the direction of the shadow at solar noon in the northern hemisphere, provided that>. If<, then the shadow points directly south. As noted in the text, neglecting the analemma effect, solar noonoccurs at clock noon at longitudes that are multiples of 15ofrom Greenwich, England (with a few notedexceptions). For other longitudes, solar noon is found from interpolation, where 15o= 60 minutes (i.e., 1hour), so 1o= 4 minutes = 1/15 hr. For example, at 80oW, solar noon occurs at (8075)6015 = 603 = 20minutes past noon, clock time.The difference between true north and compass north is the compass declination, not to be confused with thedeclination of the sun,δ. This difference is relatively small in eastern United States, but is in the range of 20in northwestern Canada. Thus, north indicated by a compass must first be corrected to true north from acompass declination table.Next, the direction of the shadow at calculated solar noon, neglecting the analemma effect, is compared withtrue north determined from the corrected compass reading. Then, note that if the sun travels 15°/hr, if theshadow “north” is west of true (corrected compass) north, then solar noon has not yet occurred. If the shadow“north” is east of true north, then the sun is west of south and solar noon has already happened. Using theangular spacing between true north and shadow “north,” one can now estimate either the time until solar noonor the time elapsed since solar noon occurred.2.12Noting the dependence of air mass onz,a.Generate a table that shows,and I (using 2.3) vs. time for a latitude of your choice on a day of yourchoice.b. Assuming a tracking collector and no cloud cover, estimate the total energy available for collection duringyour chosen day.The selection of latitude is to be made by the student. This solution will use 30oN on March 21. For this case,= 30oand= 0o. Hence,cos866.0cos30cos0cos30sin0sinsinooooandtan5774.0coscossinsinsincos.Now, usingsin1sin)90(AMAMoand678.0)AM()7.0(1367Iwith= 15(12T) for times whenthe sun is above the horizon enables the construction of a table of I vs. T, which, when summed as ITover daylight hours, gives the total irradiation per day incident on a tracking collector. The results aretabulated in the following table.

Page 12

Solution Manual for Photovoltaic Systems Engineering, 4th Edition - Page 12 preview image

Loading page image...

11TsinAMI,kW/m2cum I,kWh/m26900.00000.0090.01870319006.582.50.11306.4986.248.8472860.077750.224112.9582.374.4625110.277.567.50.331419.3678.303.0176430.568600.433025.6673.902.3097290.908.552.50.527231.8269.011.8977881.289450.612437.7663.441.6338311.699.537.50.687043.4056.911.4568632.1110300.750048.5949.101.3338862.5510.522.50.800153.1439.631.2509032.9911150.836556.7828.171.1959143.4511.57.50.858659.1614.721.1659203.911200.866060.000.001.1559234.3712.5-7.50.858659.1614.721.1659204.8313-150.836556.7828.171.1959145.2913.5-22.50.800153.1439.631.2509035.7414-300.750048.5949.101.3338866.1914.5-37.50.687043.4056.911.4568636.6315-450.612437.7663.441.6338317.0515.5-52.50.527231.8269.011.8977887.4516-600.433025.6673.902.3097297.8316.5-67.50.331419.3678.303.0176438.1817-750.224112.9582.374.4625118.4717.5-82.50.11306.4986.248.8472868.6618-900.00000.0090.01870318.708.742.13Plot I vs. AM and then plot I vs..The plots can be generated from the data from Problem 2.11 with the following results:010020030040050060070080090010000246810Irradiance, W/m^2Air MassIrradiance vs. Air Mass

Page 13

Solution Manual for Photovoltaic Systems Engineering, 4th Edition - Page 13 preview image

Loading page image...

122.14Calculate the collector orientation that will produce maximum summer output between 2 p.m. and 5 p.m. inTucson, AZ. Use July 21 as the assumed midpoint of summer and correct for the longitude of the site.The collector should face the sun at 3:30 p.m. (assume MDT) on July 21. Hence, the sun position in Tucson,AZ is needed at 3:30 p.m. on July 21. Note that on July 21, 3:30 p.m. is daylight savings time, or 2:30 p.m.standard time.The longitude of Tucson is 110.9W, so solar noon occurs at 12:24, sun time. Thus, 2:30 p.m.standard time is equivalent to 2:06 p.m. sun time. For Tucson,= 32.2oN and for July 21,o24.20365)80202(360sin45.23and= 15(12T) = 15(1214.1) =31.5o. Hence,coscoscossinsinsin= 0.861 and thus= 59.5o.Next,coscossinsinsincos= .188 so that=79.2o. (Note negative since west of south.) Hence, thecollector is pointed close to west at an altitude of 59.5o. As an interesting follow-up exercise, one might wantto calculate the position without the longitude correction. Another interesting follow-up is to note that Arizonais on pacific time instead of mountain time. Thus, the problem could also be worked using 3:30 p.m. PDT,which is based on longitude of 120, rather than 105for mountain time solar noon. This means solar noon isat 11:24 a.m. rather than 12:24 p.m. PST. Obviously the same procedures will be followed.2.15Calculate the collector orientation that will produce maximum summer output at 9 a.m. Daylight Savings Timein Minneapolis, MN, using July 21 as the assumed midpoint of summer and using a longitude correction.Minneapolis, MN has= 45oN and longitude = 93.3oW. For July 21,= 20.24o(See Problem 2.13). Tofind how 9 a.m. CDT relates to solar noon, note that at 90oW, solar noon is at 1 p.m. CDT. Hence, at 93.3oW, solar noon is 3.36015 = 13.2 minutes past the hour, or at 1:13 p.m. This means that 9 a.m. CDTcorresponds to 4 hr 13 min before solar noon. (4 hr 13 min = 4.2167 hr) Hence T12 =4.2167 hr and=15(12T) = 63.25o. Solving forandgives5432.0coscoscossinsinsinand thus= 32.9oand0643.coscossinsinsincosso thato316.86East of South.02004006008001000020406080Irradiance, W/m^2Altitude, degreesIrradiance vs. Solar Altitude

Page 14

Solution Manual for Photovoltaic Systems Engineering, 4th Edition - Page 14 preview image

Loading page image...

132.16A collector in Boca Raton, FL (= 26.4oN, longitude = 80.1W) is mounted on a roof with a 5:12 pitch,facing 30oS of W. Determine the time of day and days of the year that the direct beam radiation component isnormal to the array.A roof with a 5:12 pitch haso162.22125tan. Thus,= 90= 67.38oand 30oS of W corresponds to=60o. For Boca Raton,= 26.36oN with longitude of 80.08oW. From this information it is necessary todetermineand. Equation (2.12) can be solved for sin. The result is2375.0coscoscossinsinsinand thus= 13.74o.Next, (2.11) can be used to determine, with the result9394.0coscossinsinsincosand thus=20.05o(i.e., W of S).To find the days of the year that the sun shines directly onto the array, solve for the days for which= 13.74o.This is done using (2.5), which gives the resulto187.3545.2374.13sin365)80n(360or 144.13o.For 35.87o, n = 116, corresponding to April 26. For 144.13o, n = 226, corresponding to August 14.The time of day relative to solar noon for direct sun is found from (2.8), resulting in3367.131505.2012T, which corresponds to 13 hr 20 min solar time. To find when solar noon occurs at 80.08oW, note that solarnoon occurs at60157508.80= 20 minutes past the hour, i.e., at 12:20 p.m. EST, or at 1:20 p.m. EDT. Sincedirect sun occurs 1 hr 20 min later, it occurs at 2:40 p.m. on April 26 and August 14.2.17Determine the location (latitude and longitude) where, on May 29, sunrise is at 6:30 a.m. and sunset is at 8:08p.m. EDT. At what time does solar noon occur at this location?Solar noon is halfway between sunrise and sunset. Thus, solar noon is at608205.621= 13.317 hr ,which corresponds to 1:19 p.m. EDT. From this information, the longitude can be determined to be 75o+.W75.79156019ooThe declination on May 29 is found to beo75.21365)80149(360sin45.23.From sunrise to sunset, DH = 20.13336.500 = 13.633 hours on May 29.Finally, since DH is known to be 13.633, andis known, (2.8) can be used to solve for the latitude.633.135.7)tantan(cosDH1, so that531.0399.0212.0tanand thus= 27.985oN.2.18Using Figure 2.13, make a table of unshaded collector times for each month of the year.The line is drawn on the face of the Solar Pathfinder such that above the line represents shaded and below theline is unshaded. Shaded or unshaded is determined by the reflection of shading objects from the face of theinstrument. Hence, the following table can be generated based on the position of the chalk/crayon line on theinstrument face.

Page 15

Solution Manual for Photovoltaic Systems Engineering, 4th Edition - Page 15 preview image

Loading page image...

14MonthUnshaded timesMonthUnshaded timesJan12:451:30 p.m.Jul5:15 a.m.6:45 p.m.Febnoon2:00 p.m.Aug5:30 a.m.6:30 p.m.Mar9:30 a.m.2:45 p.m.Sep9:15 a.m.3:15 p.m.Apr5:306:30 a.m. & 8:30 a.m.6:30 p.m.Oct10:00 a.m.2:15 p.m.May5:15 a.m.6:45 p.m.Nov12:301:30 p.m.Jun5:00 a.m.7:00 p.m.Dec12:451:15 p.m.2.19An array of collectors consists of three rows of south-facing collectors as shown in Figure P2.1.If the array islocated at 40N latitude, determine the spacing, d, between the rows needed to prevent shading of one row byanother row.The smallest value ofover the year is needed for this problem. If sunrise to sunset is considered, then= 0and the spacing must be infinite. Normally it is considered to be adequate if the collector is unshaded between9 a.m. and 3 p.m. So this means that=45. For either value of,will be the same. The smallest value ofwill occur when=23.45. So for= 40,sin= sin(23.45)sin40+ cos(23.45)cos40cos45= 0.2411, so= 13.95.Then, since tan= 3d, where dis the shadow length, d= 3tan= 12.07 ft. But this shadow distance ismeasured from the projection of the high side of the module onto the roof toward the northwest, since theazimuth of the sun in the morning is toward the southeast. So the value ofis also needed. Using 2.10,=42° (i.e., east of south).The distance between rows, d, is thus found from d = dcos= 8.97 ft.2.20The top of a tree is found to be at an angle of 15between the horizontal and the corner of a collector and at anazimuth angle of30. If the site is at a latitude of 30N, determine the months (if any) when the tree willshade the array at the point from which the measurements are taken.This problem would most easily be solved with an instrument to calculate sun path. But, of course, for anengineer, this would be too simple. So the mathematical approach is used instead. The problem is todetermine whether the sun altitude dips below 15when the azimuth is30during any month of the year. Sothis means calculating the declination when the altitude, azimuth and latitude are known. Solving (2.10) forthe declination gives sin= sinsincoscoscos. Plugging in= 15,=30and= 30gives sin=0.60 and thus=36.52.Since23.45<< 23.45, this means that the tree will never be a problemunless it grows taller. For the curious person, it is interesting to calculate how tall the tree can grow before itbecomes a problem, i.e., for what value ofis=23.45.2.21A residence has a 5:12 roof pitch and is located at latitude 27N and longitude 83W, facing 15west of south.If two rows of 66 cm x 142 cm collectors are to be mounted on the back roof so they will have a tilt of latitude,as shown in Figure P2.2,a.How far apart will the rows need to be if collectors are to remain unshaded for 6 hours on December 21?b. Assuming Eastern Standard Time, over what time period on December 21 will the collectors be unshaded,assuming the collectors are facing 15west of south.c. Assuming no other shading objects, over what time period will the collectors be unshaded on March 21?a. On December 21,=23.45. For 6 hours of unshaded operation, the collector will remain unshaded from9 a.m. to 3 p.m. sun time. Thus, the altitude must be computed when= 45at the latitude of 27. The factthat the collector is facing slightly west of south means that if the collector is not shaded at 9 a.m., then it willnot be shaded at 3 p.m. so, in fact, the collector will receive a bit more than 6 hours of sun. Using (2.9) to findgives= 23.4.Referring to Figure P2.2, note thatThe 5:12 roof slope determines= tan1(5/12) = 22.62. Thismeans that= 0.78.

Page 16

Solution Manual for Photovoltaic Systems Engineering, 4th Edition - Page 16 preview image

Loading page image...

15Next, note that=+= 49.62. If the modules are mounted in landscape position, then sin= y/66 andcos= x/66 (x and y in cm). So x = 42.8 cm and y = 50.3 cm.Finally, tan= y/(d-x), so d = 3737 cm = 37.37 m. Hence, it is unlikely that the roof will be large enough tomeet the spacing constraint.b. As a first approximation, the collectors will be unshaded from 9 a.m. to 3 p.m. sun time if the spacing ofpart a can be achieved. At a longitude of 83W, solar noon will occur at 12:32 p.m. EST, so the collectors willbe unshaded from 9:32 a.m. to 3:32 p.m.c. On March 21,= 0, so if= 23.4and= 27, then, using (2.11),=63.5. This corresponds tounshaded hours 4.24 hr either side of solar noon, or from 7:46 a.m. to 4:14 p.m. sun time. Correcting time forlongitude, this results in unshaded hours from 8:18 a.m. to 4:46 p.m.2.22A commercial building has a flat roof as shown in Figure p2.3. The roof has a parapet around it that is 3 fthigh, and an air conditioner located as shown that is 4 ft above the roof. The building is located at 40 degreesnorth. A PV system is to be installed using modules that measure 3 ft by 5 ft, in rows that will remainunshaded for at least 6 hours every day of the year. The modules are to be mounted at a tilt of 25 degrees, inportrait mode, facing south. The bottom edges of the modules will be 6 inches above the roof.Determine themaximum number of modules that can be installed on the roof so that no module will be shaded during the 6-hour period. Pay attention to module rows shading other rows, shading from the air conditioner and shadingfrom the parapet. Draw a diagram that shows your result.Since the modules are raised 6 inches above the roof, this problem can be solved by treating the modules asthough their bottom edges are at ground (roof) level, the parapet is 2.5 ft tall, and the AC is 3.5 ft tall.It may be wise to first check that at least 6 hours of sunlight are available every day of the year. The leastamount of daylight hours occur when δ =23.45°. Using equation (2.8) it is found that the shortest day hasabout 9.15 hours of sunlight. Hence the problem is reasonable. It should also be clear that the desirableunshaded hours are from 9am3 pm solar time.To calculate the shadow length (and direction) for a given day and time it is necessary to findand. In thefollowing table, using equations (2.6), (2.9), and (2.10) the required angles for the first day of winter,spring/fall, and summer can be found. Also, since cosine is an even function, one must be careful to make surethe sign of the azimuth angles calculated are correct.Rather than calculate the shadow length of each side of the parapet, the modules, and the AC for each of the 3declinations, the shadow length of a pole 1 foot high will be found. Then it is only necessary to multiply anyof these shadow lengths by the actual height of our object to get the actual shadow length. In the table, Lengthcorresponds to the shadow length, N Length corresponds to the length of the shadow in the northern direction,and similarly for W Length ((N Length)2+ (W Length)2= (Length)2). Length was found using (1ft)/tan, andfor N Length and W Length, Length is multiplied by cosand sinrespectively.|------Winter------||----Fall/Spring----||-----Summer------|TIME:ωαψαψαψ9:0045.0013.9541.9532.8057.2748.8380.199:3037.5017.5635.8637.4350.0554.4273.7310:0030.0020.6629.3641.5641.9359.8265.8310:3022.5023.1722.4545.0532.8064.8355.6511:0015.0025.0315.1947.7322.6369.1741.8911:307.5026.177.6749.4211.5772.2823.1712:000.0026.550.0050.000.0073.450.0012:30-7.5026.17-7.6749.42-11.5772.28-23.171:00-15.0025.03-15.1947.73-22.6369.17-41.891:30-22.5023.17-22.4545.05-32.8064.83-55.652:00-30.0020.66-29.3641.56-41.9359.82-65.832:30-37.5017.56-35.8637.43-50.0554.42-73.733:00-45.0013.95-41.9532.80-57.2748.83-80.19
Preview Mode

This document has 75 pages. Sign in to access the full document!

Study Now!

XY-Copilot AI
Unlimited Access
Secure Payment
Instant Access
24/7 Support
Document Chat

Document Details

Related Documents

View all