Analysis Questions

Explore how environmental conditions affect population survival using bubble models. Learn about survivorship curves (Type I, II, III), r/K selection strategies, and real-world ecological parallels in this engaging biology activity.

Daniel Miller
Contributor
4.9
52
5 months ago
Preview (1 of 1 Pages)
100%
Purchase to unlock

Page 1

Analysis Questions - Page 1 preview image

Loading page ...

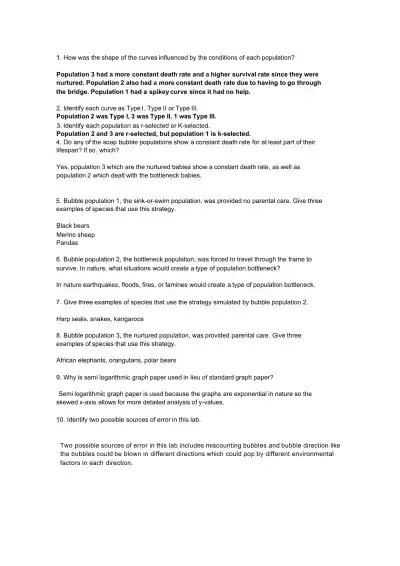
1. How was the shape of the curves influenced by the conditions of each population?Population 3 had a more constant death rate and a higher survival rate since they werenurtured. Population 2 also had a more constant death rate due to having to go throughthe bridge. Population 1 had a spikey curve since it had no help.2. Identify each curve as Type I, Type II or Type III.Population 2 was Type I, 3 was Type II, 1 was Type III.3. Identify each population as r-selected or K-selected.Population 2 and 3 are r-selected, but population 1 is k-selected.4. Do any of the soap bubble populations show a constant death rate for at least part of theirlifespan? If so;which?Yes, population 3 which are the nurtured babies show a constant death rate, as well aspopulation 2 which dealt with the bottleneck babies.5. Bubble population 1, the sink-or-swim population, was provided no parental care. Give threeexamples of species that use this strategy.Black bearsMerino sheepPandas6. Bubble population 2, the bottleneck population, was forced to travel through the frame tosurvive. In nature, what situations would create a type of population bottleneck?In nature earthquakes, floods, fires, or famines would create a type of population bottleneck.7. Give three examples of species that use the strategy simulated by bubble population 2.Harp seals, snakes, kangaroos8. Bubble population 3, the nurtured population, was provided parental care. Give threeexamples of species that use this strategy.African elephants, orangutans, polar bears9. Why is semi logarithmic graph paper used in lieu of standard graph paper?Semi logarithmic graph paper is used because the graphs are exponential in nature so theskewed x-axis allows for more detailed analysis of y-values.10. Identify two possible sources of error in this lab.Two possible sources of error in this lab includes miscounting bubbles and bubble direction likethe bubbles could be blown in different directions which could pop by different environmentalfactors in each direction.

Study Now!

XY-Copilot AI
Unlimited Access
Secure Payment
Instant Access
24/7 Support
Document Chat

Document Details

Subject
Biology

Related Documents

View all