Solution Manual for Market-Based Management, 6th Edition

Solution Manual for Market-Based Management, 6th Edition helps you tackle difficult exercises with expert guidance.

Madison Taylor
Contributor
5.0
171
8 months ago
Preview (31 of 180 Pages)
100%
Purchase to unlock

Page 1

Solution Manual for Market-Based Management, 6th Edition - Page 1 preview image

Loading page image...

Page 2

Solution Manual for Market-Based Management, 6th Edition - Page 2 preview image

Loading page image...

Page 3

Solution Manual for Market-Based Management, 6th Edition - Page 3 preview image

Loading page image...

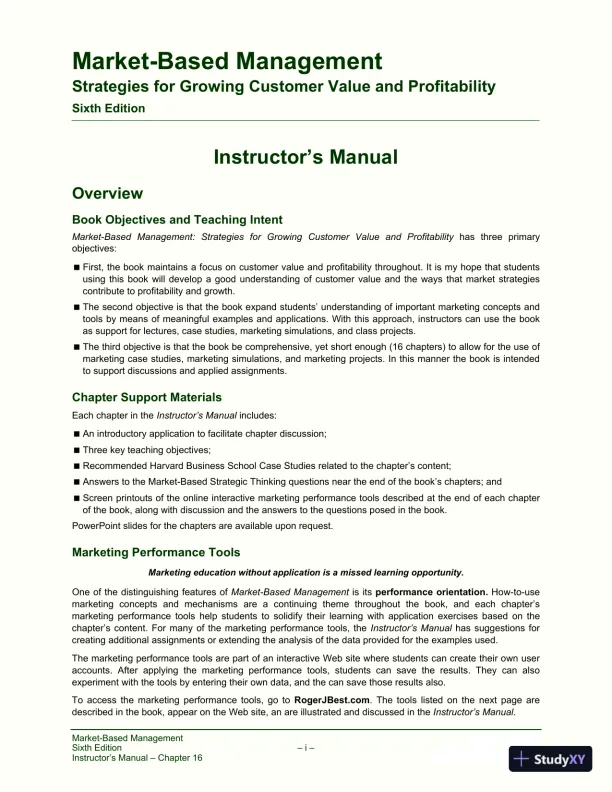
Market-Based ManagementSixth Edition– i –Instructor’s Manual – Chapter 16Market-Based ManagementStrategies for Growing Customer Value and ProfitabilitySixth EditionInstructor’s ManualOverviewBook Objectives and Teaching IntentMarket-BasedManagement:StrategiesforGrowingCustomerValueandProfitabilityhasthreeprimaryobjectives:First, the book maintains a focus on customer value and profitability throughout. It is my hope that studentsusing this book will develop a good understanding of customer value and the ways that market strategiescontribute to profitability and growth.The second objective is that the book expand students’ understanding of important marketing concepts andtools by means of meaningful examples and applications. With this approach, instructors can use the bookas support for lectures, case studies, marketing simulations, and class projects.The third objective is that the book be comprehensive, yet short enough (16 chapters) to allow for the use ofmarketing case studies, marketing simulations, and marketing projects. In this manner the book is intendedto support discussions and applied assignments.Chapter Support MaterialsEach chapter in theInstructor’s Manualincludes:An introductory application to facilitate chapter discussion;Three key teaching objectives;Recommended Harvard Business School Case Studies related to the chapter’s content;Answers to the Market-Based Strategic Thinking questions near the end of the book’s chapters; andScreen printouts of the online interactive marketing performance tools described at the end of each chapterof the book, along with discussion and the answers to the questions posed in the book.PowerPoint slides for the chapters are available upon request.Marketing Performance ToolsMarketing education without application is a missed learning opportunity.One of the distinguishing features ofMarket-Based Managementis itsperformance orientation.How-to-usemarketing concepts andmechanismsare a continuing theme throughout the book, and each chapter’smarketing performance tools help students to solidify their learning with application exercises based on thechapter’s content. For many of the marketing performance tools, theInstructor’s Manualhas suggestions forcreating additional assignments or extending the analysis of the data provided for the examples used.The marketing performance tools are part of an interactive Web site where students can create their own useraccounts. After applying the marketing performance tools, students can save the results. They can alsoexperiment with the tools by entering their own data, and the can save those results also.To access the marketing performance tools, go toRogerJBest.com. The tools listed on the next page aredescribed in the book, appear on the Web site, an are illustrated and discussed in theInstructor’s Manual.

Page 4

Solution Manual for Market-Based Management, 6th Edition - Page 4 preview image

Loading page image...

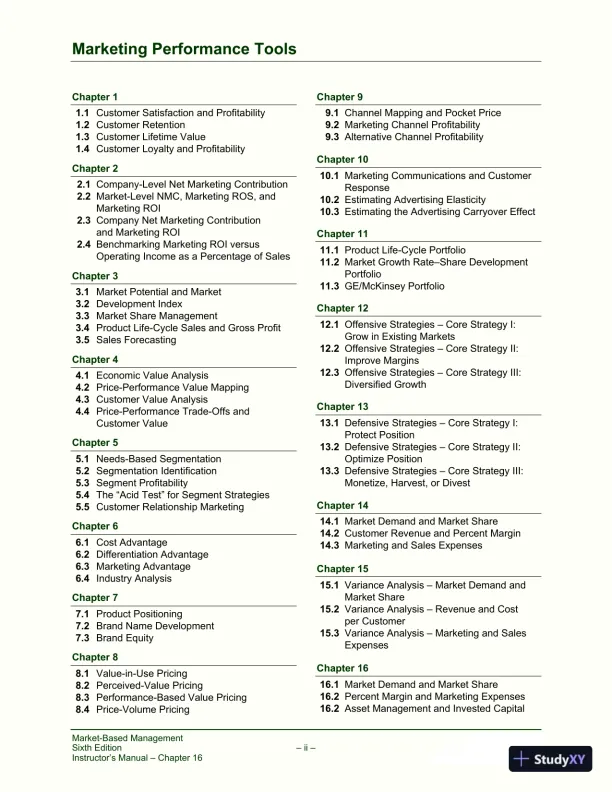
Market-Based ManagementSixth Edition– ii –Instructor’s Manual – Chapter 16Marketing Performance ToolsChapter 11.1Customer Satisfaction and Profitability1.2Customer Retention1.3Customer Lifetime Value1.4Customer Loyalty and ProfitabilityChapter 22.1Company-Level Net Marketing Contribution2.2Market-Level NMC, Marketing ROS, andMarketing ROI2.3Company Net Marketing Contributionand Marketing ROI2.4Benchmarking Marketing ROI versusOperating Income as a Percentage of SalesChapter 33.1Market Potential and Market3.2Development Index3.3Market Share Management3.4Product Life-Cycle Sales and Gross Profit3.5Sales ForecastingChapter 44.1Economic Value Analysis4.2Price-Performance Value Mapping4.3Customer Value Analysis4.4Price-Performance Trade-Offs andCustomer ValueChapter 55.1Needs-Based Segmentation5.2Segmentation Identification5.3Segment Profitability5.4The “Acid Test” for Segment Strategies5.5Customer Relationship MarketingChapter 66.1Cost Advantage6.2Differentiation Advantage6.3Marketing Advantage6.4Industry AnalysisChapter 77.1Product Positioning7.2Brand Name Development7.3Brand EquityChapter 88.1Value-in-Use Pricing8.2Perceived-Value Pricing8.3Performance-Based Value Pricing8.4Price-Volume PricingChapter 99.1Channel Mapping and Pocket Price9.2Marketing Channel Profitability9.3Alternative Channel ProfitabilityChapter 1010.1Marketing Communications and CustomerResponse10.2Estimating Advertising Elasticity10.3Estimating the Advertising Carryover EffectChapter 1111.1Product Life-Cycle Portfolio11.2Market Growth Rate–Share DevelopmentPortfolio11.3GE/McKinsey PortfolioChapter 1212.1Offensive Strategies – Core Strategy I:Grow in Existing Markets12.2Offensive Strategies – Core Strategy II:Improve Margins12.3Offensive Strategies – Core Strategy III:Diversified GrowthChapter 1313.1Defensive Strategies – Core Strategy I:Protect Position13.2Defensive Strategies – Core Strategy II:Optimize Position13.3Defensive Strategies – Core Strategy III:Monetize, Harvest, or DivestChapter 1414.1Market Demand and Market Share14.2Customer Revenue and Percent Margin14.3Marketing and Sales ExpensesChapter 1515.1Variance Analysis – Market Demand andMarket Share15.2Variance Analysis – Revenue and Costper Customer15.3Variance Analysis – Marketing and SalesExpensesChapter 1616.1Market Demand and Market Share16.2Percent Margin and Marketing Expenses16.2Asset Management and Invested Capital

Page 5

Solution Manual for Market-Based Management, 6th Edition - Page 5 preview image

Loading page image...

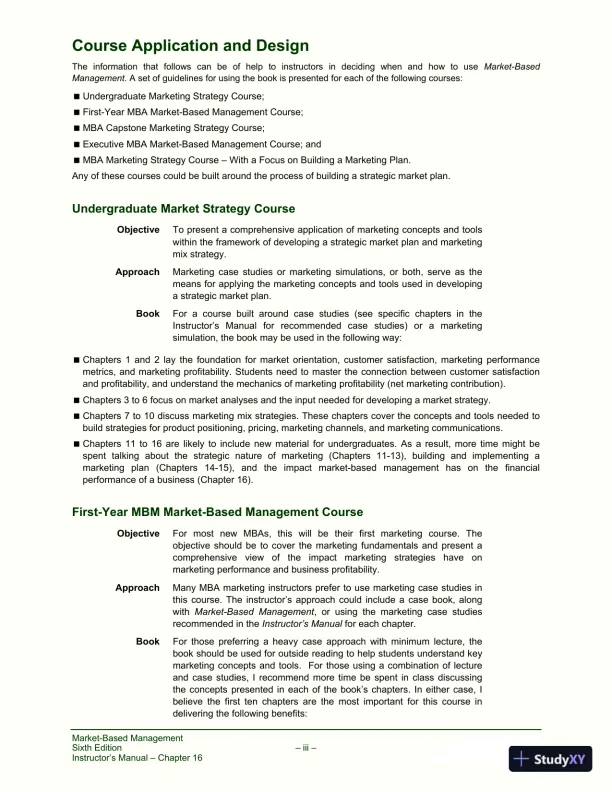
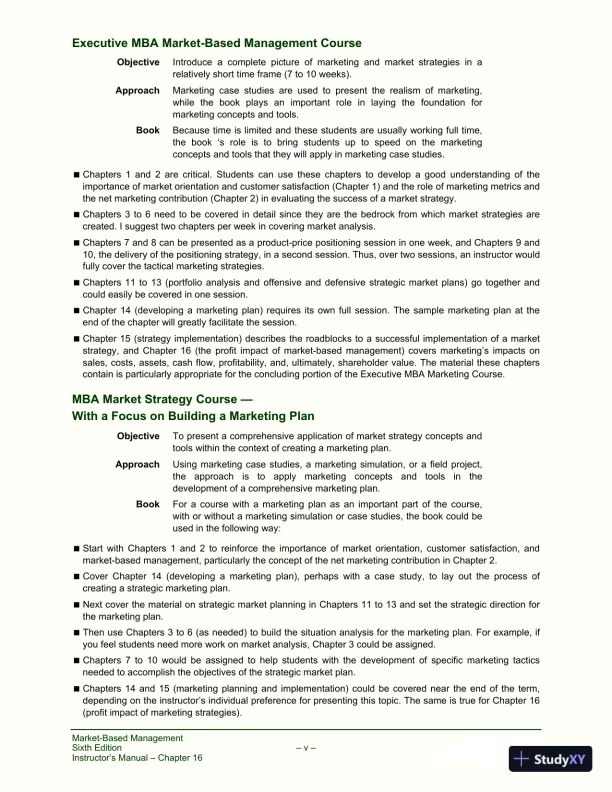
Market-Based ManagementSixth Edition– iii –Instructor’s Manual – Chapter 16Course Application and DesignTheinformationthatfollowscanbeofhelptoinstructorsindecidingwhenandhowtouseMarket-BasedManagement.A set of guidelines for using the book is presented for each of the following courses:Undergraduate Marketing Strategy Course;First-Year MBA Market-Based Management Course;MBA Capstone Marketing Strategy Course;Executive MBA Market-Based Management Course; andMBA Marketing Strategy Course – With a Focus on Building a Marketing Plan.Any of these courses could be built around the process of building a strategic market plan.Undergraduate Market Strategy CourseObjectiveTo present a comprehensive application of marketing concepts and toolswithin the framework of developing a strategic market plan and marketingmix strategy.ApproachMarketing case studies or marketing simulations, or both, serve as themeans for applying the marketing concepts and tools used in developinga strategic market plan.BookFor a course built around case studies (see specific chapters in theInstructor’sManualforrecommendedcasestudies)oramarketingsimulation, the book may be used in the following way:Chapters 1 and 2 lay the foundation for market orientation, customer satisfaction, marketing performancemetrics, and marketing profitability. Students need to master the connection between customer satisfactionand profitability, and understand the mechanics of marketing profitability (net marketing contribution).Chapters 3 to 6 focus on market analyses and the input needed for developing a market strategy.Chapters 7 to 10 discuss marketing mix strategies. These chapters cover the concepts and tools needed tobuild strategies for product positioning, pricing, marketing channels, and marketing communications.Chapters 11 to 16 are likely to include new material for undergraduates. As a result, more time might bespenttalkingaboutthestrategicnatureofmarketing(Chapters11-13),buildingandimplementingamarketingplan(Chapters14-15),andtheimpactmarket-basedmanagementhasonthefinancialperformance of a business (Chapter 16).First-Year MBM Market-Based Management CourseObjectiveFormostnewMBAs,thiswillbetheirfirstmarketingcourse.Theobjective should be to cover the marketing fundamentals and present acomprehensiveviewoftheimpactmarketingstrategieshaveonmarketing performance and business profitability.ApproachMany MBA marketing instructors prefer to use marketing case studies inthis course. The instructor’s approach could include a case book, alongwithMarket-Based Management, or using the marketing case studiesrecommended in theInstructor’s Manualfor each chapter.BookFor those preferring a heavy case approach with minimum lecture, thebook should be used for outside reading to help students understand keymarketing concepts and tools.For those using a combination of lectureand case studies, I recommend more time be spent in class discussingthe concepts presented in each of the book’s chapters. In either case, Ibelieve the first ten chapters are the most important for this course indelivering the following benefits:

Page 6

Solution Manual for Market-Based Management, 6th Edition - Page 6 preview image

Loading page image...

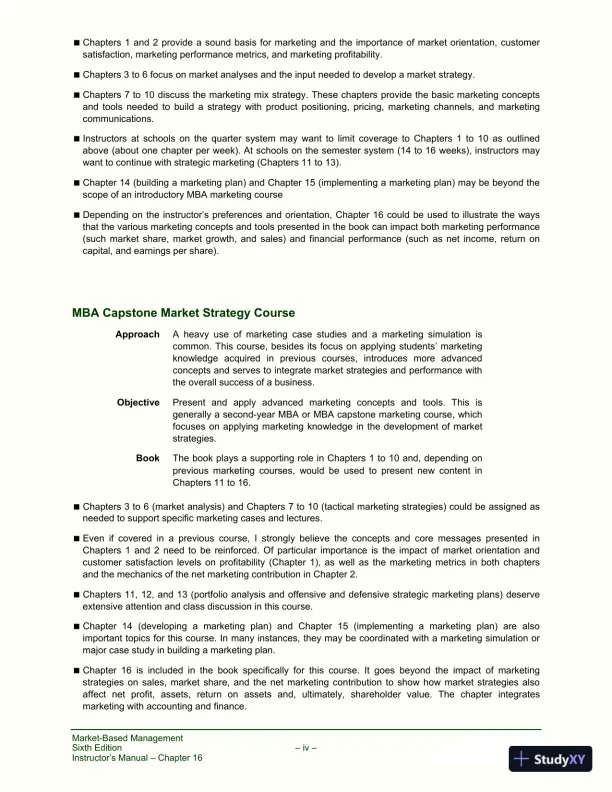
Market-Based ManagementSixth Edition– iv –Instructor’s Manual – Chapter 16Chapters 1 and 2 provide a sound basis for marketing and the importance of market orientation, customersatisfaction, marketing performance metrics, and marketing profitability.Chapters 3 to 6 focus on market analyses and the input needed to develop a market strategy.Chapters 7 to 10 discuss the marketing mix strategy. These chapters provide the basic marketing conceptsand tools needed to build a strategy with product positioning, pricing, marketing channels, and marketingcommunications.Instructors at schools on the quarter system may want to limit coverage to Chapters 1 to 10 as outlinedabove (about one chapter per week). At schools on the semester system (14 to 16 weeks), instructors maywant to continue with strategic marketing (Chapters 11 to 13).Chapter 14 (building a marketing plan) and Chapter 15 (implementing a marketing plan) may be beyond thescope of an introductory MBA marketing courseDepending on the instructor’s preferences and orientation, Chapter 16 could be used to illustrate the waysthat the various marketing concepts and tools presented in the book can impact both marketing performance(such market share, market growth, and sales) and financial performance (such as net income, return oncapital, and earnings per share).MBA Capstone Market Strategy CourseApproachA heavy use of marketing case studies and a marketing simulation iscommon. This course, besides its focus on applying students’ marketingknowledgeacquiredinpreviouscourses,introducesmoreadvancedconcepts and serves to integrate market strategies and performance withthe overall success of a business.ObjectivePresentandapplyadvancedmarketingconceptsandtools.Thisisgenerally a second-year MBA or MBA capstone marketing course, whichfocuses on applying marketing knowledge in the development of marketstrategies.BookThe book plays a supporting role in Chapters 1 to 10 and, depending onprevious marketing courses, would be used to present new content inChapters 11 to 16.Chapters 3 to 6 (market analysis) and Chapters 7 to 10 (tactical marketing strategies) could be assigned asneeded to support specific marketing cases and lectures.Even if covered in a previous course, I strongly believe the concepts and core messages presented inChapters 1 and 2 need to be reinforced. Of particular importance is the impact of market orientation andcustomer satisfaction levels on profitability (Chapter 1), as well as the marketing metrics in both chaptersand the mechanics of the net marketing contribution in Chapter 2.Chapters 11, 12, and 13 (portfolio analysis and offensive and defensive strategic marketing plans) deserveextensive attention and class discussion in this course.Chapter 14 (developing a marketing plan) and Chapter 15 (implementing a marketing plan) are alsoimportant topics for this course. In many instances, they may be coordinated with a marketing simulation ormajor case study in building a marketing plan.Chapter 16 is included in the book specifically for this course. It goes beyond the impact of marketingstrategies on sales, market share, and the net marketing contribution to show how market strategies alsoaffectnetprofit,assets,returnonassetsand,ultimately,shareholdervalue.Thechapterintegratesmarketing with accounting and finance.

Page 7

Solution Manual for Market-Based Management, 6th Edition - Page 7 preview image

Loading page image...

Market-Based ManagementSixth Edition– v –Instructor’s Manual – Chapter 16Executive MBA Market-Based Management CourseObjectiveIntroduce a complete picture of marketing and market strategies in arelatively short time frame (7 to 10 weeks).ApproachMarketing case studies are used to present the realism of marketing,whilethebookplaysanimportantroleinlayingthefoundationformarketing concepts and tools.BookBecause time is limited and these students are usually working full time,the book ‘s role is to bring students up to speed on the marketingconcepts and tools that they will apply in marketing case studies.Chapters 1 and 2 are critical. Students can use these chapters to develop a good understanding of theimportance of market orientation and customer satisfaction (Chapter 1) and the role of marketing metrics andthe net marketing contribution (Chapter 2) in evaluating the success of a market strategy.Chapters 3 to 6 need to be covered in detail since they are the bedrock from which market strategies arecreated. I suggest two chapters per week in covering market analysis.Chapters 7 and 8 can be presented as a product-price positioning session in one week, and Chapters 9 and10, the delivery of the positioning strategy, in a second session. Thus, over two sessions, an instructor wouldfully cover the tactical marketing strategies.Chapters 11 to 13 (portfolio analysis and offensive and defensive strategic market plans) go together andcould easily be covered in one session.Chapter 14 (developing a marketing plan) requires its own full session. The sample marketing plan at theend of the chapter will greatly facilitate the session.Chapter 15 (strategy implementation) describes the roadblocks to a successful implementation of a marketstrategy, and Chapter 16 (the profit impact of market-based management) covers marketing’s impacts onsales, costs, assets, cash flow, profitability, and, ultimately, shareholder value. The material these chapterscontain is particularly appropriate for the concluding portion of the Executive MBA Marketing Course.MBA Market Strategy Course —With a Focus on Building a Marketing PlanObjectiveTo present a comprehensive application of market strategy concepts andtools within the context of creating a marketing plan.ApproachUsing marketing case studies, a marketing simulation, or a field project,theapproachistoapplymarketingconceptsandtoolsinthedevelopment of a comprehensive marketing plan.BookFor a course with a marketing plan as an important part of the course,with or without a marketing simulation or case studies, the book could beused in the following way:Start with Chapters 1 and 2 to reinforce the importance of market orientation, customer satisfaction, andmarket-based management, particularly the concept of the net marketing contribution in Chapter 2.Cover Chapter 14 (developing a marketing plan), perhaps with a case study, to lay out the process ofcreating a strategic marketing plan.Next cover the material on strategic market planning in Chapters 11 to 13 and set the strategic direction forthe marketing plan.Then use Chapters 3 to 6 (as needed) to build the situation analysis for the marketing plan. For example, ifyou feel students need more work on market analysis, Chapter 3 could be assigned.Chapters 7 to 10 would be assigned to help students with the development of specific marketing tacticsneeded to accomplish the objectives of the strategic market plan.Chapters 14 and 15 (marketing planning and implementation) could be covered near the end of the term,depending on the instructor’s individual preference for presenting this topic. The same is true for Chapter 16(profit impact of marketing strategies).

Page 8

Solution Manual for Market-Based Management, 6th Edition - Page 8 preview image

Loading page image...

Page 9

Solution Manual for Market-Based Management, 6th Edition - Page 9 preview image

Loading page image...

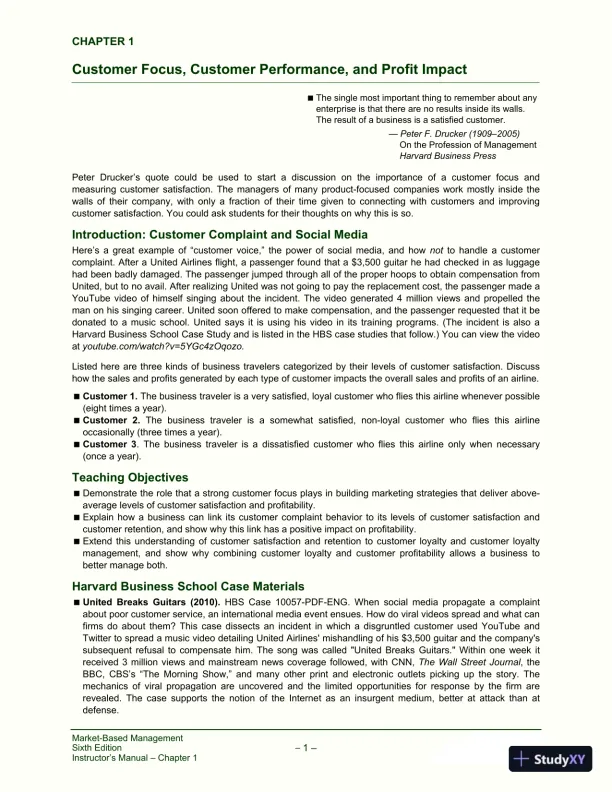
Market-Based ManagementSixth Edition1 –Instructor’s Manual – Chapter 1CHAPTER 1Customer Focus, Customer Performance, and Profit ImpactThe single most important thing to remember about anyenterprise is that there are no results inside its walls.The result of a business is a satisfied customer.— Peter F. Drucker (1909–2005)On the Profession of ManagementHarvard Business PressPeter Drucker’s quote could be used to start a discussion on the importance of a customer focus andmeasuring customer satisfaction. The managers of many product-focused companies work mostly inside thewalls of their company, with only a fraction of their time given to connecting with customers and improvingcustomer satisfaction. You could ask students for their thoughts on why this is so.Introduction: Customer Complaint and Social MediaHere’s a great example of “customer voice,” the power of social media, and hownotto handle a customercomplaint. After a United Airlines flight, a passenger found that a $3,500 guitar he had checked in as luggagehad been badly damaged. The passenger jumped through all of the proper hoops to obtain compensation fromUnited, but to no avail. After realizing United was not going to pay the replacement cost, the passenger made aYouTube video of himself singing about the incident. The video generated 4 million views and propelled theman on his singing career. United soon offered to make compensation, and the passenger requested that it bedonated to a music school. United says it is using his video in its training programs. (The incident is also aHarvard Business School Case Study and is listed in the HBS case studies that follow.) You can view the videoatyoutube.com/watch?v=5YGc4zOqozo.Listed here are three kinds of business travelers categorized by their levels of customer satisfaction. Discusshow the sales and profits generated by each type of customer impacts the overall sales and profits of an airline.Customer 1.The business traveler is a very satisfied, loyal customer who flies this airline whenever possible(eight times a year).Customer 2.The business traveler is a somewhat satisfied, non-loyal customer who flies this airlineoccasionally (three times a year).Customer 3. The business traveler is a dissatisfied customer who flies this airline only when necessary(once a year).Teaching ObjectivesDemonstrate the role that a strong customer focus plays in building marketing strategies that deliver above-average levels of customer satisfaction and profitability.Explain how a business can link its customer complaint behavior to its levels of customer satisfaction andcustomer retention, and show why this link has a positive impact on profitability.Extend this understanding of customer satisfaction and retention to customer loyalty and customer loyaltymanagement, and show why combining customer loyalty and customer profitability allows a business tobetter manage both.Harvard Business School Case MaterialsUnited BreaksGuitars (2010).HBS Case 10057-PDF-ENG. When social media propagate a complaintabout poor customer service, an international media event ensues. How do viral videos spread and what canfirms do about them? This case dissects an incident in which a disgruntled customer used YouTube andTwitter to spread a music video detailing United Airlines' mishandling of his $3,500 guitar and the company'ssubsequent refusal to compensate him. The song was called "United Breaks Guitars." Within one week itreceived 3 million views and mainstream news coverage followed, with CNN,The Wall Street Journal, theBBC, CBS’s “The Morning Show,” and many other print and electronic outlets picking up the story. Themechanics of viral propagation are uncovered and the limited opportunities for response by the firm arerevealed. The case supports the notion of the Internet as an insurgent medium, better at attack than atdefense.

Page 10

Solution Manual for Market-Based Management, 6th Edition - Page 10 preview image

Loading page image...

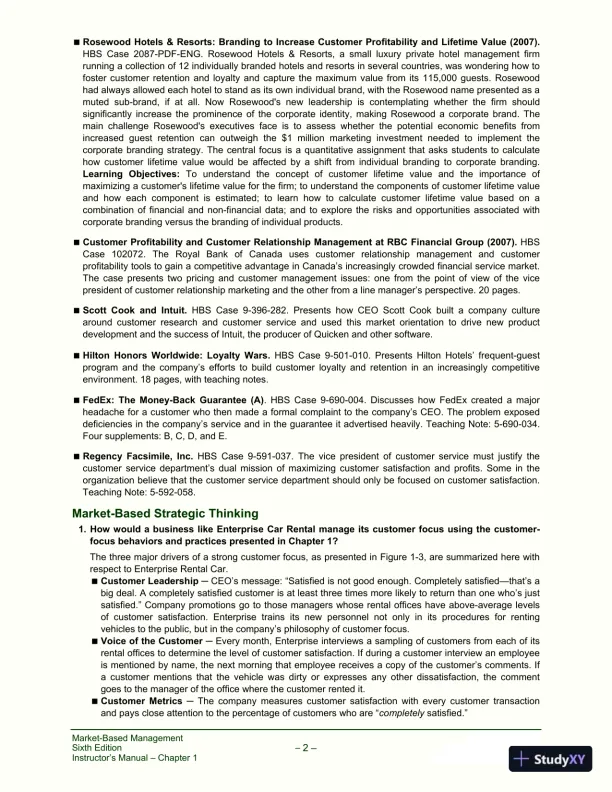
Market-Based ManagementSixth Edition2 –Instructor’s Manual – Chapter 1Rosewood Hotels & Resorts: Branding to Increase Customer Profitability and Lifetime Value (2007).HBS Case 2087-PDF-ENG. Rosewood Hotels & Resorts, a small luxury private hotel management firmrunning a collection of 12 individually branded hotels and resorts in several countries, was wondering how tofoster customer retention and loyalty and capture the maximum value from its 115,000 guests. Rosewoodhad always allowed each hotel to stand as its own individual brand, with the Rosewood name presented as amuted sub-brand, if at all. Now Rosewood's new leadership is contemplating whether the firm shouldsignificantly increase the prominence of the corporate identity, making Rosewood a corporate brand. Themain challenge Rosewood's executives face is to assess whether the potential economic benefits fromincreased guest retention can outweigh the $1 million marketing investment needed to implement thecorporate branding strategy. The central focus is a quantitative assignment that asks students to calculatehow customer lifetime value would be affected by a shift from individual branding to corporate branding.LearningObjectives:Tounderstandtheconceptofcustomerlifetimevalueandtheimportanceofmaximizing a customer's lifetime value for the firm; to understand the components of customer lifetime valueand how each component is estimated; to learn how to calculate customer lifetime value based on acombination of financial and non-financial data; and to explore the risks and opportunities associated withcorporate branding versus the branding of individual products.Customer Profitability and Customer Relationship Management at RBC Financial Group (2007).HBSCase102072.TheRoyalBankofCanadausescustomerrelationshipmanagementandcustomerprofitability tools to gain a competitive advantage in Canada’s increasingly crowded financial service market.The case presents two pricing and customer management issues: one from the point of view of the vicepresident of customer relationship marketing and the other from a line manager’s perspective. 20 pages.Scott Cook and Intuit.HBS Case 9-396-282. Presents how CEO Scott Cook built a company culturearound customer research and customer service and used this market orientation to drive new productdevelopment and the success of Intuit, the producer of Quicken and other software.Hilton Honors Worldwide: Loyalty Wars.HBS Case 9-501-010. Presents Hilton Hotels’ frequent-guestprogram and the company’s efforts to build customer loyalty and retention in an increasingly competitiveenvironment. 18 pages, with teaching notes.FedEx: The Money-Back Guarantee (A). HBS Case 9-690-004. Discusses how FedEx created a majorheadache for a customer who then made a formal complaint to the company’s CEO. The problem exposeddeficiencies in the company’s service and in the guarantee it advertised heavily. Teaching Note: 5-690-034.Four supplements: B, C, D, and E.Regency Facsimile, Inc.HBS Case 9-591-037. The vice president of customer service must justify thecustomer service department’s dual mission of maximizing customer satisfaction and profits. Some in theorganization believe that the customer service department should only be focused on customer satisfaction.Teaching Note: 5-592-058.Market-Based Strategic Thinking1. How would a business like Enterprise Car Rental manage its customer focus using the customer-focus behaviors and practices presented in Chapter 1?The three major drivers of a strong customer focus, as presented in Figure 1-3, are summarized here withrespect to Enterprise Rental Car.Customer LeadershipCEO’s message: “Satisfied is not good enough. Completely satisfied—that’s abig deal. A completely satisfied customer is at least three times more likely to return than one who’s justsatisfied.” Company promotions go to those managers whose rental offices have above-average levelsof customer satisfaction. Enterprise trains its new personnel not only in its procedures for rentingvehicles to the public, but in the company’s philosophy of customer focus.Voice of the CustomerEvery month, Enterprise interviews a sampling of customers from each of itsrental offices to determine the level of customer satisfaction. If during a customer interview an employeeis mentioned by name, the next morning that employee receives a copy of the customer’s comments. Ifa customer mentions that the vehicle was dirty or expresses any other dissatisfaction, the commentgoes to the manager of the office where the customer rented it.Customer MetricsThe company measures customer satisfaction with every customer transactionand pays close attention to the percentage of customers who are “completelysatisfied.”

Page 11

Solution Manual for Market-Based Management, 6th Edition - Page 11 preview image

Loading page image...

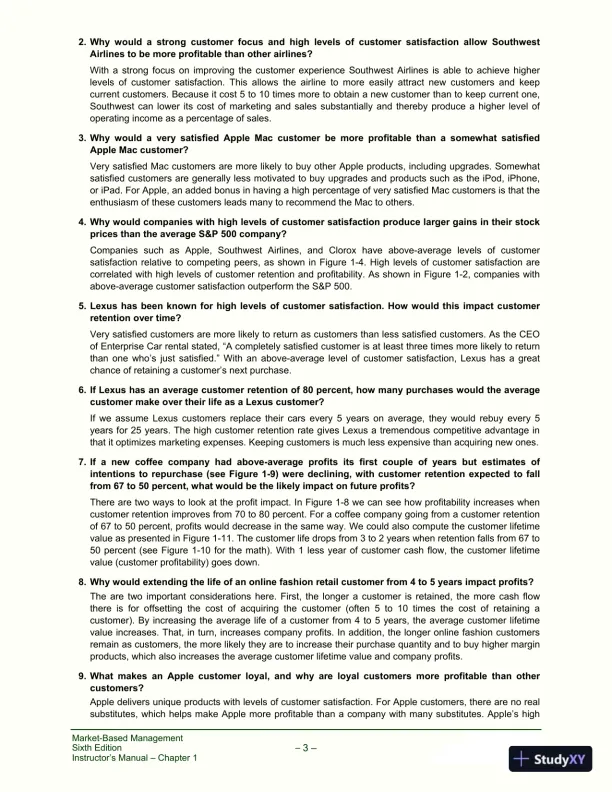
Market-Based ManagementSixth Edition3 –Instructor’s Manual – Chapter 12. Why would a strong customer focus and high levels of customer satisfaction allow SouthwestAirlines to be more profitable than other airlines?With a strong focus on improving the customer experience Southwest Airlines is able to achieve higherlevels of customer satisfaction. This allows the airline to more easily attract new customers and keepcurrent customers. Because it cost 5 to 10 times more to obtain a new customer than to keep current one,Southwest can lower its cost of marketing and sales substantially and thereby produce a higher level ofoperating income as a percentage of sales.3. Why would a very satisfied Apple Mac customer be more profitable than a somewhat satisfiedApple Mac customer?Very satisfied Mac customers are more likely to buy other Apple products, including upgrades. Somewhatsatisfied customers are generally less motivated to buy upgrades and products such as the iPod, iPhone,or iPad. For Apple, an added bonus in having a high percentage of very satisfied Mac customers is that theenthusiasm of these customers leads many to recommend the Mac to others.4. Why would companies with high levels of customer satisfaction produce larger gains in their stockprices than the average S&P 500 company?CompaniessuchasApple,SouthwestAirlines,andClorox haveabove-averagelevelsofcustomersatisfaction relative to competing peers, as shown in Figure 1-4. High levels of customer satisfaction arecorrelated with high levels of customer retention and profitability. As shown in Figure 1-2, companies withabove-average customer satisfaction outperform the S&P 500.5. Lexus has been known for high levels of customer satisfaction. How would this impact customerretention over time?Very satisfied customers are more likely to return as customers than less satisfied customers. As the CEOof Enterprise Car rental stated, “A completely satisfied customer is at least three times more likely to returnthan one who’s just satisfied.” With an above-average level of customer satisfaction, Lexus has a greatchance of retaining a customer’s next purchase.6. If Lexus has an average customer retention of 80 percent, how many purchases would the averagecustomer make over their life as a Lexus customer?If we assume Lexus customers replace their cars every 5 years on average, they would rebuy every 5years for 25 years. The high customer retention rate gives Lexus a tremendous competitive advantage inthat it optimizes marketing expenses. Keeping customers is much less expensive than acquiring new ones.7. If a new coffee company had above-average profits its first couple of years but estimates ofintentions to repurchase (see Figure 1-9) were declining, with customer retention expected to fallfrom 67 to 50 percent, what would be the likely impact on future profits?There are two ways to look at the profit impact. In Figure 1-8 we can see how profitability increases whencustomer retention improves from 70 to 80 percent. For a coffee company going from a customer retentionof 67 to 50 percent, profits would decrease in the same way. We could also compute the customer lifetimevalue as presented in Figure 1-11. The customer life drops from 3 to 2 years when retention falls from 67 to50 percent (see Figure 1-10 for the math). With 1 less year of customer cash flow, the customer lifetimevalue (customer profitability) goes down.8. Why would extending the life of an online fashion retail customer from 4 to 5 years impact profits?The are two important considerations here. First, the longer a customer is retained, the more cash flowthere is for offsetting the cost of acquiring the customer (often 5 to 10 times the cost of retaining acustomer). By increasing the average life of a customer from 4 to 5 years, the average customer lifetimevalue increases. That, in turn, increases company profits. In addition, the longer online fashion customersremain as customers, the more likely they are to increase their purchase quantity and to buy higher marginproducts, which also increases the average customer lifetime value and company profits.9. What makes an Apple customer loyal, and why are loyal customers more profitable than othercustomers?Apple delivers unique products with levels of customer satisfaction. For Apple customers, there are no realsubstitutes, which helps make Apple more profitable than a company with many substitutes. Apple’s high

Page 12

Solution Manual for Market-Based Management, 6th Edition - Page 12 preview image

Loading page image...

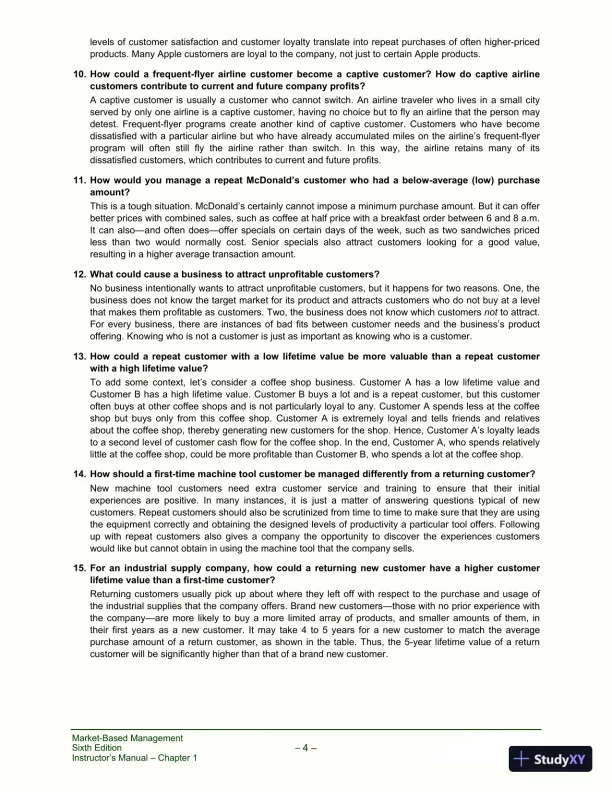
Market-Based ManagementSixth Edition4 –Instructor’s Manual – Chapter 1levels of customer satisfaction and customer loyalty translate into repeat purchases of often higher-pricedproducts. Many Apple customers are loyal to the company, not just to certain Apple products.10. How could a frequent-flyer airline customer become a captive customer? How do captive airlinecustomers contribute to current and future company profits?A captive customer is usually a customer who cannot switch. An airline traveler who lives in a small cityserved by only one airline is a captive customer, having no choice but to fly an airline that the person maydetest. Frequent-flyer programs create another kind of captive customer. Customers who have becomedissatisfied with a particular airline but who have already accumulated miles on the airline’s frequent-flyerprogram will often still fly the airline rather than switch. In this way, the airline retains many of itsdissatisfied customers, which contributes to current and future profits.11. How would you manage a repeat McDonald’s customer who had a below-average (low) purchaseamount?This is a tough situation. McDonald’s certainly cannot impose a minimum purchase amount. But it can offerbetter prices with combined sales, such as coffee at half price with a breakfast order between 6 and 8 a.m.It can also—and often does—offer specials on certain days of the week, such as two sandwiches pricedless than two would normally cost. Senior specials also attract customers looking for a good value,resulting in a higher average transaction amount.12. What could cause a business to attract unprofitable customers?No business intentionally wants to attract unprofitable customers, but it happens for two reasons. One, thebusiness does not know the target market for its product and attracts customers who do not buy at a levelthat makes them profitable as customers. Two, the business does not know which customersnotto attract.For every business, there are instances of bad fits between customer needs and the business’s productoffering. Knowing who is not a customer is just as important as knowing who is a customer.13. How could a repeat customer with a low lifetime value be more valuable than a repeat customerwith a high lifetime value?To add some context, let’s consider a coffee shop business. Customer A has a low lifetime value andCustomer B has a high lifetime value. Customer B buys a lot and is a repeat customer, but this customeroften buys at other coffee shops and is not particularly loyal to any. Customer A spends less at the coffeeshop but buys only from this coffee shop. Customer A is extremely loyal and tells friends and relativesabout the coffee shop, thereby generating new customers for the shop. Hence, Customer A’s loyalty leadsto a second level of customer cash flow for the coffee shop. In the end, Customer A, who spends relativelylittle at the coffee shop, could be more profitable than Customer B, who spends a lot at the coffee shop.14. How should a first-time machine tool customer be managed differently from a returning customer?Newmachinetoolcustomersneedextracustomerserviceandtrainingtoensurethattheirinitialexperiences are positive. In many instances, it is just a matter of answering questions typical of newcustomers. Repeat customers should also be scrutinized from time to time to make sure that they are usingthe equipment correctly and obtaining the designed levels of productivity a particular tool offers. Followingup with repeat customers also gives a company the opportunity to discover the experiences customerswould like but cannot obtain in using the machine tool that the company sells.15. For an industrial supply company, how could a returning new customer have a higher customerlifetime value than a first-time customer?Returning customers usually pick up about where they left off with respect to the purchase and usage ofthe industrial supplies that the company offers. Brand new customers—those with no prior experience withthe company—are more likely to buy a more limited array of products, and smaller amounts of them, intheir first years as a new customer. It may take 4 to 5 years for a new customer to match the averagepurchase amount of a return customer, as shown in the table. Thus, the 5-year lifetime value of a returncustomer will be significantly higher than that of a brand new customer.

Page 13

Solution Manual for Market-Based Management, 6th Edition - Page 13 preview image

Loading page image...

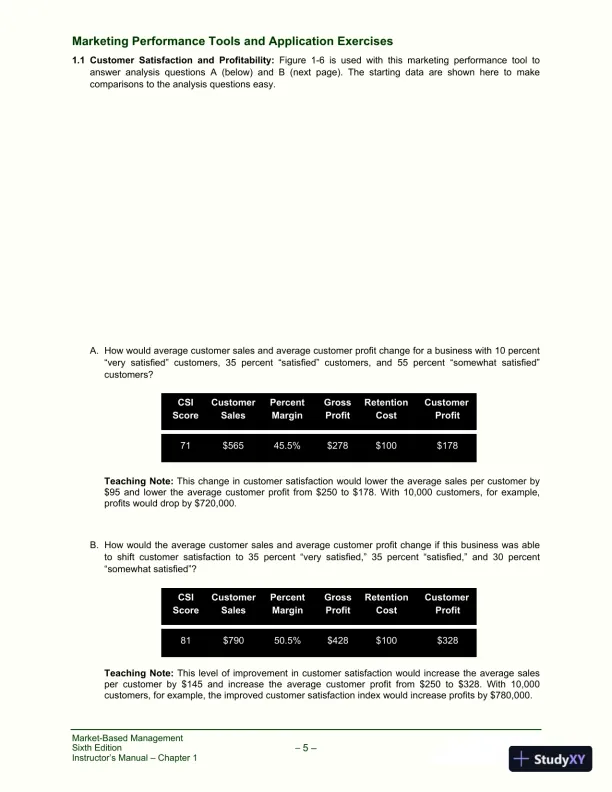
Market-Based ManagementSixth Edition5 –Instructor’s Manual – Chapter 1Marketing Performance Tools and Application Exercises1.1 Customer Satisfaction and Profitability:Figure 1-6 is used with this marketing performance tool toanswer analysis questions A (below) and B (next page). The starting data are shown here to makecomparisons to the analysis questions easy.A. How would average customer sales and average customer profit change for a business with 10 percent“very satisfied” customers, 35 percent “satisfied” customers, and 55 percent “somewhat satisfied”customers?Teaching Note:This change in customer satisfaction would lower the average sales per customer by$95 and lower the average customer profit from $250 to $178. With 10,000 customers, for example,profits would drop by $720,000.B. How would the average customer sales and average customer profit change if this business was ableto shift customer satisfaction to 35 percent “very satisfied,” 35 percent “satisfied,” and 30 percent“somewhat satisfied”?Teaching Note:This level of improvement in customer satisfaction would increase the average salesper customer by $145 and increase the average customer profit from $250 to $328. With 10,000customers, for example, the improved customer satisfaction index would increase profits by $780,000.CSICustomerPercentGrossRetentionCustomerScoreSalesMarginProfitCostProfit71$56545.5%$278$100$178CSICustomerPercentGrossRetentionCustomerScoreSalesMarginProfitCostProfit81$79050.5%$428$100$328

Page 14

Solution Manual for Market-Based Management, 6th Edition - Page 14 preview image

Loading page image...

Market-Based ManagementSixth Edition6 –Instructor’s Manual – Chapter 11.2 Customer Retention:Figure 1-7 is used with this marketing performance tool to answer questions A (nextpage) and B on page 8.

Page 15

Solution Manual for Market-Based Management, 6th Edition - Page 15 preview image

Loading page image...

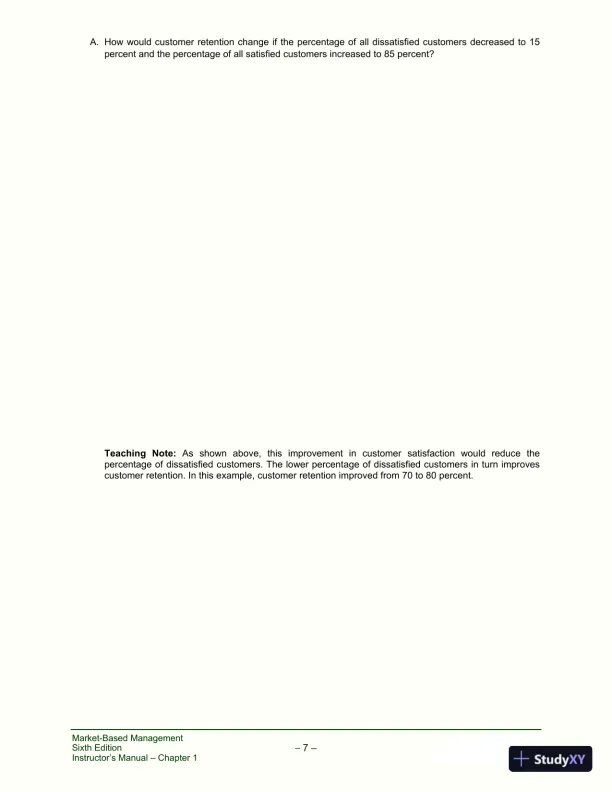
Market-Based ManagementSixth Edition7 –Instructor’s Manual – Chapter 1A. How would customer retention change if the percentage of all dissatisfied customers decreased to 15percent and the percentage of all satisfied customers increased to 85 percent?TeachingNote:Asshownabove,thisimprovementincustomersatisfactionwouldreducethepercentage of dissatisfied customers. The lower percentage of dissatisfied customers in turn improvescustomer retention. In this example, customer retention improved from 70 to 80 percent.

Page 16

Solution Manual for Market-Based Management, 6th Edition - Page 16 preview image

Loading page image...

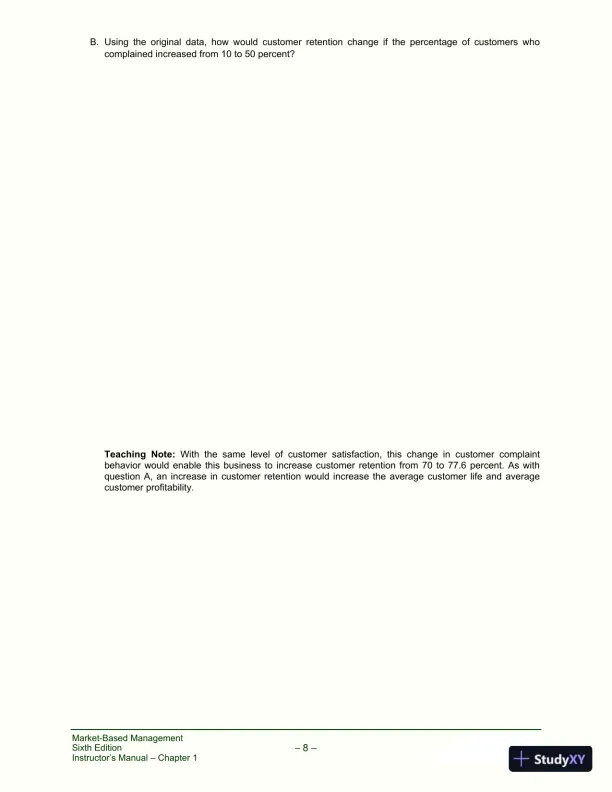
Market-Based ManagementSixth Edition8 –Instructor’s Manual – Chapter 1B. Using the original data, how would customer retention change if the percentage of customers whocomplained increased from 10 to 50 percent?Teaching Note:With the same level of customer satisfaction, this change in customer complaintbehavior would enable this business to increase customer retention from 70 to 77.6 percent. As withquestion A, an increase in customer retention would increase the average customer life and averagecustomer profitability.

Page 17

Solution Manual for Market-Based Management, 6th Edition - Page 17 preview image

Loading page image...

Market-Based ManagementSixth Edition9 –Instructor’s Manual – Chapter 11.3 Customer Lifetime Value:Figure 1-11 is used with this marketing performance tool to answer questions Aand B below.A. How would the lifetime value of the average customer change if the customer life was shortened from 5to 4 years?Teaching Note:A 4-year customer life corresponds with a 75 percent customer retention rate (seeFigure 1-10). This would eliminate year 5 from the customer cash flow. The net result is a decrease inthe lifetime value of a customer from $111.66 to $77.51. Although the customer is still profitable, thebusiness will lower its overall profitability since it now has to replace that customer every 4 yearsinstead of every 5 years.B. How would the lifetime value change if the customer life was extended from 5 to 6 years and in year 6the net cash flow was $60?Teaching Note:A 6-year customer life corresponds to an 83.3 percent customer retention rate. If weadd year 6 at the same level of profit as year 5 ($55), then the average customer lifetime valueincreases from $111.66 to $142.46, which would have a significant positive impact on overall profits.1.4 Customer Loyalty and Profitability:Figure 1-17 is used with this marketing performance tool to answeranalysis questions A and B on the next page. The starting data are shown here to make comparisons tothe analysis questions easy.

Page 18

Solution Manual for Market-Based Management, 6th Edition - Page 18 preview image

Loading page image...

Market-Based ManagementSixth Edition10 –Instructor’s Manual – Chapter 1A. How would the average customer profitability change with 25 percent loyal and 25 percent repeatcustomers?Teaching Note:This change would increase the average customer revenue by $13 and the averagecustomerprofitby$9.Thesemayseemlikesmalldifferences,butforabusinesswith10,000customers the impact would be significant.B. How would the average customer profit change with the following loyalty: 30 percent loyal, 35 percentrepeat, 5 percent captive, 20 percent new, and 10 percent unprofitable?Teaching Note:These changes would have a much greater impact on sales and profits. Averagecustomer revenue would increase by $98, and the average customer profit would increase by $45. Fora business with 10,000 customers, the improvement in performance would be significant: overallcustomer revenue would increase by $980,000, and customer profits would increase by $450,000.

Page 19

Solution Manual for Market-Based Management, 6th Edition - Page 19 preview image

Loading page image...

Market-Based ManagementSixth Edition11Instructor’s Manual – Chapter 2CHAPTER 2Marketing Metrics and Marketing ProfitabilityIntroductory ExerciseFedEx measures customer satisfaction monthly but measures its service quality daily with a process metric thattracks the top ten mistakes, weighted by their negative impact on the customer, that result in customerdissatisfaction. The day on which this internal forward-looking metric was at its lowest (fewest mistakes), FedExproduced its highest daily profit.1. Discuss the value of both measures (customer satisfaction and service quality) and how one relates tothe other.2. Discuss why these are important forward-looking metrics, and how each contributes to performance.3. Discuss why FedEx’s profit would be at its highest when the company’s internal measure of servicequality was at its lowest (fewest errors).Teaching ObjectivesPresent the importance of marketing performance metrics and make clear the characteristics and roles ofexternal and internal metrics and of forward-looking and backward-looking performance metrics.Illustrate how a market-based business continues to reengineer itself around markets as customer needsand competition change and new market opportunities emerge.Demonstrate the importance of market-level measures of profitability and how the mechanics of the netmarketing contribution can be applied to a variety of marketing strategies.Harvard Business School Case MaterialsHarrah’s Entertainment, Inc.HBS Case 50201. Describes a situation facing Philip Satre, chairman andCEO of Harrah’s Entertainment Inc. Satre has just read a May 2000Wall Street Journalstory that discussedthe company’s marketing success in targeting low rollers, the 100 percent growth in stock price and profitsfor 1999, and the revenue growth of 50 percent, which significantly outpaced the industry. The excitingarticle aroused Satre’s desire to know more about the activities of then-COO Gary Loveman and his team of“propeller heads” with respect to their database marketing efforts and the Total Reward Program. Satre wasinterested in two questions: He wanted to know how much these marketing efforts had contributed toHarrah’s overall performance and whether these marketing results were a one-time event or could berepeated year after year, especially as competitors move to introduce similar programs. 27 pages.Buy Low, Sell High: Creating and Extracting Customer Value by Enhancing Organizational Performance.HBS Case 9-0597-0071. This case study provides a framework for creating customer value and managingfirm-level profitability. It focuses on the use of product line management and customer service to achievecustomer satisfaction and high profitability.Guest First Hotel (A).HBS Case 9-602-099. Presents a hotel management situation in which customerloyalty is linked to financial performance. This case uses years of hotel data that students need to analyze touncovertherelationshipbetweencustomerloyaltyandfinancialperformance.Althoughthereisnorelationship in a single year, over time a key marketing profitability relationship emerges. 4 pages.Winchell Lighting, Inc.HBS Case 9-187-074. This case documents how a midsize lighting company tracksit marketing costs, as well as unit costs and allocated costs, to more fully understand its profitability.Teaching Note: 5-192-034. Supplement: 9-187-075.Direct Product Profitability at Hannaford Brothers Co.HBS Case 9-591-002. Concerns the pioneeringuse of a method of accounting in retailing which takes into account not only sales and the cost of goods soldbut, at the item level, all of the variable costs associated with each item sold. This case focuses on thestrengths andweaknesses of Hannaford’s use of direct product profit and the opportunities for, andobstacles hindering, improvement and extension of the direct product profit system.

Page 20

Solution Manual for Market-Based Management, 6th Edition - Page 20 preview image

Loading page image...

Market-Based ManagementSixth Edition12Instructor’s Manual – Chapter 2The Customer Pyramid.HBS Case CRM 211. This reading provides students with an insight into differentlevelsofcustomerprofitability.“TheCustomerPyramid”providesamarketingmanagementtoolthatstrengthens the link between service quality and profitability. 26 pages.Market-Based Strategic Thinking1. How could marketing metrics help General Motors turn around its decline in sales and profits?GM has many internal performance metrics with regard to production, employee productivity, and financialperformance. Metrics for these categories are standard for manufacturing companies. The importance ofmarketing metrics rests in their external measurements of performance. Ratings of customer satisfaction,intentions to repurchase, brand preference, and customer complaints provide an external scorecard forassessing current performance. Many of these marketing metrics are forward-looking metrics that helpforecast future performance. For example, declining customer satisfaction and decreasing intentions topurchase GM vehicles in the future would signal a serious problem ahead. Likewise, improvements inthese marketing metrics would signal the potential for a bright future.2. If a company dominates a market the way Microsoft, Google, and Intel dominate their markets, whyshould that company bother to track marketing metrics?All market leaders stumble at some point. U.S. Steel, GM, and IBM all seemed invincible at one time.Without external marketing metrics, a company is vulnerable to listening to itself and not the voice of thecustomer. Customer complaints, shifting customer preferences, customer satisfaction, and intentions torepurchase are valuable external barometers that can warn a company before declines in sales and profitsoccur. A company could have many captive customers, unhappy but with no place to go. When presentedan opportunity to buy elsewhere, however, these dissatisfied captive customers will exit en masse.3. How would marketing metrics help a company like McDonald’s better manage its profitability?Bymeasuringthenetmarketingcontribution,marketingROI,andmarketingROSofeachofitsrestaurants, McDonald’s could better understand average performance as well as above- and below-average performance. A portfolio performance analysis could be performed, similar to Figure 2-17, to showthe overall company average and all stores in different regions, and the average performance for differentregions. Other marketing metrics like complaint behavior and customer satisfaction scores could be tied tothese marketing profitability metrics to further illuminate and help improve the company’s performance.4. How would Toyota use forward-looking marketing metrics to better understand future sales andprofits in the U.S. market?Changes in customer satisfaction, and particularly changes in the percentage of “very satisfied” customers,along with measurements of intentions to repurchase, provide external metrics of company performancethat shape future sales and profit performance. These forward-looking marketing metrics provide earlywarning signs of problems, but they can also be encouraging signs when the metrics are improving.5. How could a Wall Street analyst benefit from access to a company’s marketing metrics for acompany like BioTronics?Wall Street analysts could benefit from measuring a company’s marketing ROI and marketing ROS.Improvementsordeclinesinthesemarketingprofitabilitymetricsprovideameasureofcompanyperformance in addition to the company’s internal financial metrics. If the difference between marketingROS and operating income as a percentage of sales is abnormally high, it would indicate excess companyoverhead. Analysts could benchmark a company against publically traded peers, as in Figure 2-23, andthey could also benchmark company performance against Fortune 500 companies, as in Figure 2-24.6. Why are most financial metrics backward-looking metrics?Financial metrics like sales, percent gross margin, operating income, earnings per share, and all returnmeasures, such as ROS, ROA, ROE, ROC, are measured at the end of a financial accounting period. Theyare a measure of what happened, not what is happening or could happen in the future. They are bydefinition backward-looking performance metrics.

Page 21

Solution Manual for Market-Based Management, 6th Edition - Page 21 preview image

Loading page image...

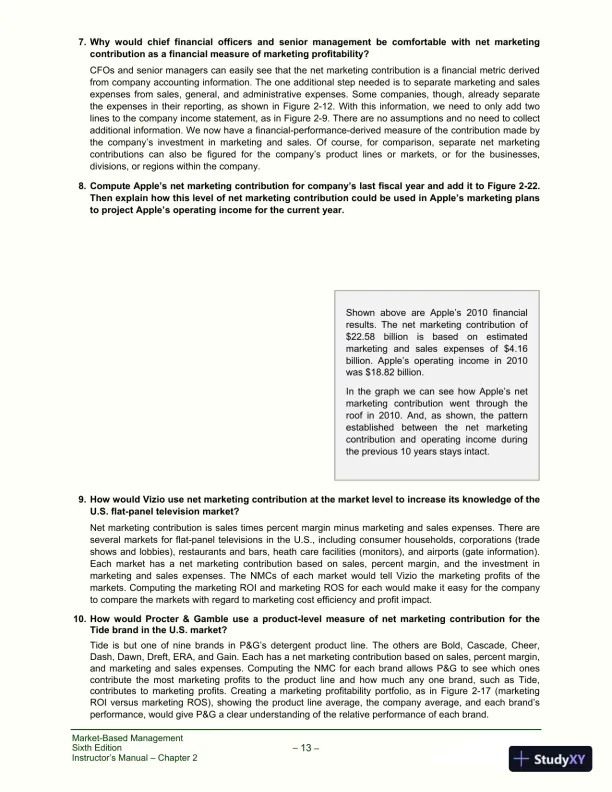
Market-Based ManagementSixth Edition13Instructor’s Manual – Chapter 27. Why would chief financial officers and senior management be comfortable with net marketingcontribution as a financial measure of marketing profitability?CFOs and senior managers can easily see that the net marketing contribution is a financial metric derivedfrom company accounting information. The one additional step needed is to separate marketing and salesexpenses from sales, general, and administrative expenses. Some companies, though, already separatethe expenses in their reporting, as shown in Figure 2-12. With this information, we need to only add twolines to the company income statement, as in Figure 2-9. There are no assumptions and no need to collectadditional information. We now have a financial-performance-derived measure of the contribution made bythe company’s investment in marketing and sales. Of course, for comparison, separate net marketingcontributions can also be figured for the company’s product lines or markets, or for the businesses,divisions, or regions within the company.8. Compute Apple’s net marketing contribution for company’s last fiscal year and add it to Figure 2-22.Then explain how this level of net marketing contribution could be used in Apple’s marketing plansto project Apple’s operating income for the current year.9. How would Vizio use net marketing contribution at the market level to increase its knowledge of theU.S. flat-panel television market?Net marketing contribution is sales times percent margin minus marketing and sales expenses. There areseveral markets for flat-panel televisions in the U.S., including consumer households, corporations (tradeshows and lobbies), restaurants and bars, heath care facilities (monitors), and airports (gate information).Each market has a net marketing contribution based on sales, percent margin, and the investment inmarketing and sales expenses. The NMCs of each market would tell Vizio the marketing profits of themarkets. Computing the marketing ROI and marketing ROS for each would make it easy for the companyto compare the markets with regard to marketing cost efficiency and profit impact.10. How would Procter & Gamble use a product-level measure of net marketing contribution for theTide brand in the U.S. market?Tide is but one of nine brands in P&G’s detergent product line. The others are Bold, Cascade, Cheer,Dash, Dawn, Dreft, ERA, and Gain. Each has a net marketing contribution based on sales, percent margin,and marketing and sales expenses. Computing the NMC for each brand allows P&G to see which onescontribute the most marketing profits to the product line and how much any one brand, such as Tide,contributes to marketing profits. Creating a marketing profitability portfolio, as in Figure 2-17 (marketingROI versus marketing ROS), showing the product line average, the company average, and each brand’sperformance, would give P&G a clear understanding of the relative performance of each brand.Shown above are Apple’s 2010 financialresults. The net marketing contribution of$22.58billionisbasedonestimatedmarketingandsalesexpensesof$4.16billion. Apple’s operating income in 2010was $18.82 billion.In the graph we can see how Apple’s netmarketingcontributionwentthroughtheroof in 2010. And, as shown, the patternestablishedbetweenthenetmarketingcontribution and operating income duringthe previous 10 years stays intact.

Page 22

Solution Manual for Market-Based Management, 6th Edition - Page 22 preview image

Loading page image...

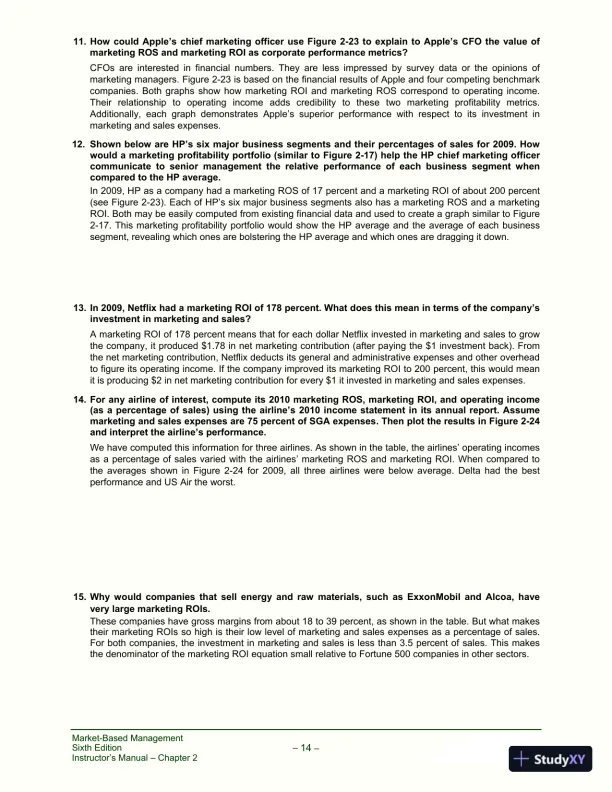
Market-Based ManagementSixth Edition14Instructor’s Manual – Chapter 211. How could Apple’s chief marketing officer use Figure 2-23 to explain to Apple’s CFO the value ofmarketing ROS and marketing ROI as corporate performance metrics?CFOs are interested in financial numbers. They are less impressed by survey data or the opinions ofmarketing managers. Figure 2-23 is based on the financial results of Apple and four competing benchmarkcompanies. Both graphs show how marketing ROI and marketing ROS correspond to operating income.Theirrelationshiptooperatingincomeaddscredibilitytothesetwomarketingprofitabilitymetrics.Additionally, each graph demonstrates Apple’s superior performance with respect to its investment inmarketing and sales expenses.12. Shown below are HP’s six major business segments and their percentages of sales for 2009. Howwould a marketing profitability portfolio (similar to Figure 2-17) help the HP chief marketing officercommunicate to senior management the relative performance of each business segment whencompared to the HP average.In 2009, HP as a company had a marketing ROS of 17 percent and a marketing ROI of about 200 percent(see Figure 2-23). Each of HP’s six major business segments also has a marketing ROS and a marketingROI. Both may be easily computed from existing financial data and used to create a graph similar to Figure2-17. This marketing profitability portfolio would show the HP average and the average of each businesssegment, revealing which ones are bolstering the HP average and which ones are dragging it down.13. In 2009, Netflix had a marketing ROI of 178 percent. What does this mean in terms of the company’sinvestment in marketing and sales?A marketing ROI of 178 percent means that for each dollar Netflix invested in marketing and sales to growthe company, it produced $1.78 in net marketing contribution (after paying the $1 investment back). Fromthe net marketing contribution, Netflix deducts its general and administrative expenses and other overheadto figure its operating income. If the company improved its marketing ROI to 200 percent, this would meanit is producing $2 in net marketing contribution for every $1 it invested in marketing and sales expenses.14. For any airline of interest, compute its 2010 marketing ROS, marketing ROI, and operating income(as a percentage of sales) using the airline’s 2010 income statement in its annual report. Assumemarketing and sales expenses are 75 percent of SGA expenses. Then plot the results in Figure 2-24and interpret the airline’s performance.We have computed this information for three airlines. As shown in the table, the airlines’ operating incomesas a percentage of sales varied with the airlines’ marketing ROS and marketing ROI. When compared tothe averages shown in Figure 2-24 for 2009, all three airlines were below average. Delta had the bestperformance and US Air the worst.15. Why would companies that sell energy and raw materials, such as ExxonMobil and Alcoa, havevery large marketing ROIs.These companies have gross margins from about 18 to 39 percent, as shown in the table. But what makestheir marketing ROIs so high is their low level of marketing and sales expenses as a percentage of sales.For both companies, the investment in marketing and sales is less than 3.5 percent of sales. This makesthe denominator of the marketing ROI equation small relative to Fortune 500 companies in other sectors.

Page 23

Solution Manual for Market-Based Management, 6th Edition - Page 23 preview image

Loading page image...

Market-Based ManagementSixth Edition15Instructor’s Manual – Chapter 2Marketing Performance Tools and Application Exercises2.1 Company-Level Net Marketing Contribution:Figure 2-15 is used with this marketing performance tool toaddress analysis items A (next page) and B (page 19). The starting data are shown here to makecomparisons with the analysis items easy.

Page 24

Solution Manual for Market-Based Management, 6th Edition - Page 24 preview image

Loading page image...

Market-Based ManagementSixth Edition16Instructor’s Manual – Chapter 2A. Evaluate the profit impact of eliminating the casual shorts and knitted sweaters product lines.Teaching Note:Sales drop by $25 million and the net marketing contribution drops by $3 million. Moreimportantly, net profit (before taxes) falls by 30 percent, from $10 million to $7 million. The point forstudents to understand is that, as long as the market profit is positive, it is contributing to other fixedcosts and profits. The $20 million in operating expenses is not product related but represents overheadexpenses that will still occur without these two product lines. Then the operating expenses would haveto be covered by the remaining product lines.

Page 25

Solution Manual for Market-Based Management, 6th Edition - Page 25 preview image

Loading page image...

Market-Based ManagementSixth Edition17Instructor’s Manual – Chapter 2B. What would be the profit impact of increasing market share from 2 to 3 percent for the casual shortsproduct line if marketing and sales expenses were doubled ($1.5 million to $3 million)?Teaching Note:While this strategy would produce $5.1 million more in sales, the net marketing con-tribution would drop by $200,000. The gains in market share and sales are not enough at currentmargins to offset a $1.5 million increase in marketing and sales expenses. As shown, this loss drops tothe bottom line where net profit (before taxes) also drops by $200,000. You could instruct students tosearch for the market share needed to make this strategy equal the current net marketing contribution(starting data). This exercise produces an interesting benchmark, as the needed market share would bethe minimum share level required to keep the strategy from adversely impacting net profit.

Page 26

Solution Manual for Market-Based Management, 6th Edition - Page 26 preview image

Loading page image...

Market-Based ManagementSixth Edition18Instructor’s Manual – Chapter 22.2 Market-Level NMC, Marketing ROS, and Marketing ROI:Figure 2-18 is used with this marketingperformance tool to address analysis items A (next page) and B (page 22). The starting data are shownhere to make comparisons with the analysis items easy.

Page 27

Solution Manual for Market-Based Management, 6th Edition - Page 27 preview image

Loading page image...

Market-Based ManagementSixth Edition19Instructor’s Manual – Chapter 2A. Evaluate the profit impact of exiting the fashion segment.Teaching Note:This would be a disastrous decision. Despite a low pretax net profit of $300,000, thefashion segment generates $6.8 million in marketing profits. This amount covers the $6.5 million inallocated operating expenses, which the business would have to pay regardless of whether it exits thissegment. While the strategy lowers the marketing budget by $6.5 million, the business’s overall netprofit would be reduced by $6.8 million, the exact amount of the current net marketing contribution forthe fashion segment.

Page 28

Solution Manual for Market-Based Management, 6th Edition - Page 28 preview image

Loading page image...

Market-Based ManagementSixth Edition20Instructor’s Manual – Chapter 2B. In the fashion segment, how much market share would the business have to obtain to keep the samelevel of marketing profits if the business doubled marketing and sales expenses in that segment?Teaching Note:The current market share of 3.5 percent would have to increase to 5.2 percent tomaintain a net marketing contribution of $6.8 million when the marketing and sales budget is doubled to$13 million. As shown, this level of market share also holds net profit at $10 million, while salesincrease by $18 million. These data provide a basis for a discussion around profitability and marketshare. Is it reasonable to expect the business would gain 1.7 percent in market share if it doubles themarketing and sales budget? Obviously, the larger the share gain needed to hold profits, the greater isthe risk of lower profits.

Page 29

Solution Manual for Market-Based Management, 6th Edition - Page 29 preview image

Loading page image...

Market-Based ManagementSixth Edition21Instructor’s Manual – Chapter 22.3 Company Net Marketing Contribution and Marketing ROI:Figure 2-13 is used with this marketingperformance tool to address items A and B (below) and C (next page).A. For a company of interest, obtain the required input from a company annual report. Evaluate thecompany’s marketing profitability and how it contributes to net profit before taxes.Teaching Note:If students obtain their company data off the Internet, they will probably have to useSGA expenses (sales, general, and administrative expenses), as most companies do not reportmarketingandsalesexpensesseparately.BecauseSGAexpensesincludeotherexpenses,Irecommend using 75 percent of SGA expenses as an approximation of the marketing and salesexpenses.B. How would marketing profits and net profit change if sales increased by 25 percent?Teaching Note:For the data presented above, when sales are increased 25 percent with no otherchanges, profits and marketing profitability metrics all improve. If we also increase marketing and salesexpenses by 25 percent, profits still go up but the marketing profitability metrics (marketing ROS andmarketing ROI) stay the same. A good point for discussion is, “How much should the marketing andsales expenses increase to achieve a 25 percent gain in sales?” There is no right or wrong answer,except something has to change to account for the increase in sales, even in a market growing at 25percent annually.

Page 30

Solution Manual for Market-Based Management, 6th Edition - Page 30 preview image

Loading page image...

Market-Based ManagementSixth Edition22Instructor’s Manual – Chapter 2C. Evaluate the profit impact of a strategy in which the percent margin is increased by 5 points andmarketing and sales expenses are increased by 2 percentage points.Teaching Note:As shown, this strategy produces an increase of $3.375 million in the net marketingcontribution. An additional assignment would be to instruct students to find the level of percent marginthat would yield no increase in the net marketing contribution while still spending the extra 2 percent onmarketing and sales. This occurs at 40.8 percent. If the company cannot increase its margins beyond40.8 percent, it will see no increase in marketing profits. You can use this variation on the assignmentto start a discussion around the risk of such a strategy.

Page 31

Solution Manual for Market-Based Management, 6th Edition - Page 31 preview image

Loading page image...

Market-Based ManagementSixth Edition23Instructor’s Manual – Chapter 22.4 Benchmarking Marketing ROI versus Operating Income as a Percentage of Sales:Figure 2-23 isused with this marketing performance tool to create the data needed to address items A (below) and B(next page).A. For a company of interest, go online and obtain the operating income and the data needed to estimatethe company’s marketing ROI. You will probably need to use 75 percent of SGA expenses as yourestimate of marketing and sales expenses, because companies rarely report marketing and salesexpenses separately in their financial statements.Teaching Note:I recommend using the following keywords to search for a company income statement:Google Keywords:Company Name YearIncome Statement ForbesExample:General Motors 2011 Income Statement ForbesIn this example, we used General Motors’ 2011 Income Statement for the company focus and for thedata shown above under “GM 2011.”
Preview Mode

This document has 180 pages. Sign in to access the full document!

Study Now!

XY-Copilot AI
Unlimited Access
Secure Payment
Instant Access
24/7 Support
Document Chat

Document Details

Subject
Marketing

Related Documents

View all